Iraqi vs Tongan Median Male Earnings
COMPARE
Iraqi
Tongan
Median Male Earnings
Median Male Earnings Comparison
Iraqis
Tongans
$54,182
MEDIAN MALE EARNINGS
42.5/ 100
METRIC RATING
180th/ 347
METRIC RANK
$53,218
MEDIAN MALE EARNINGS
22.3/ 100
METRIC RATING
199th/ 347
METRIC RANK
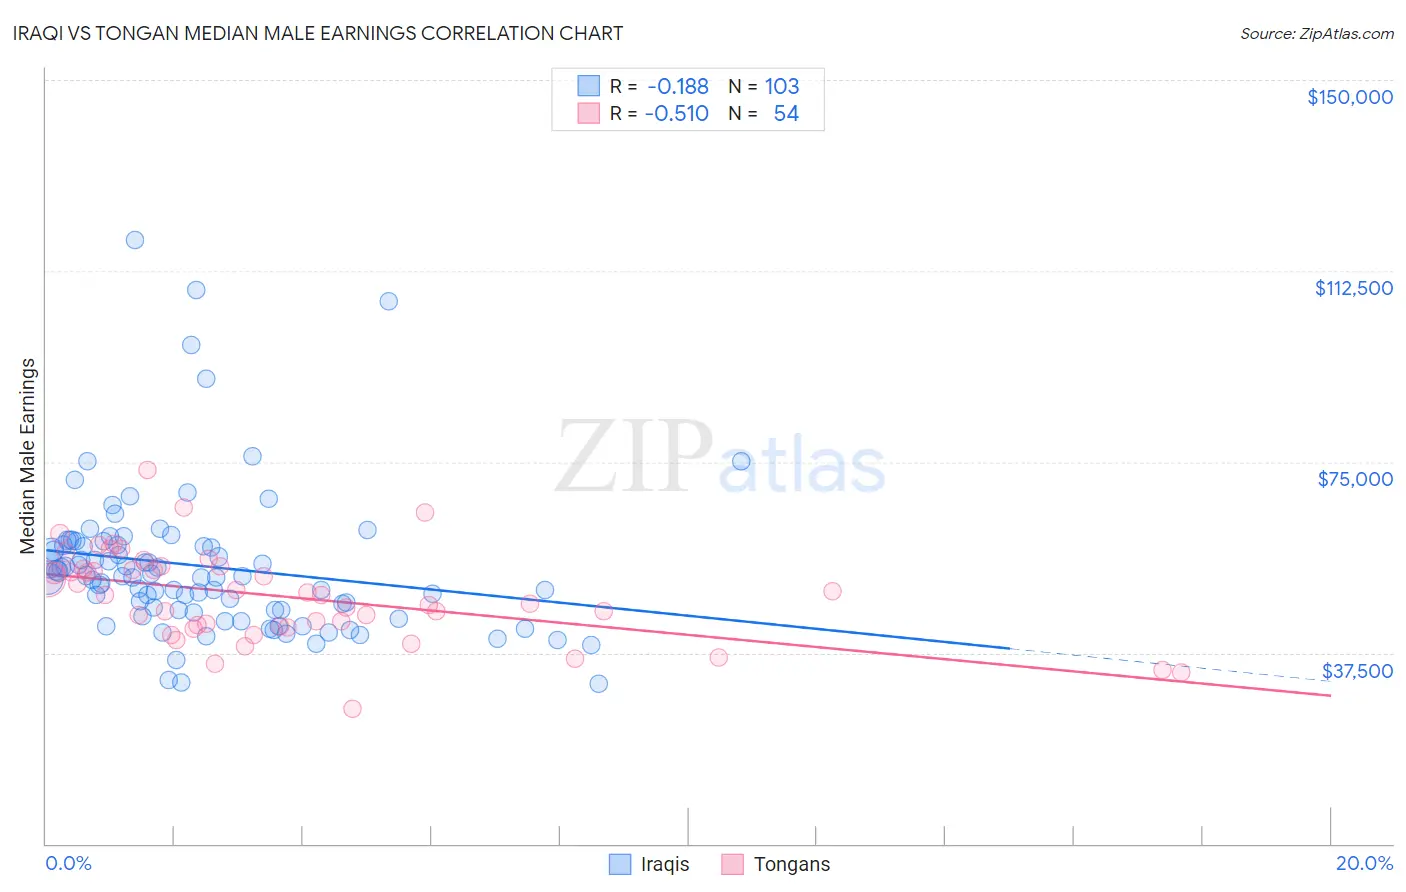
Iraqi vs Tongan Median Male Earnings Correlation Chart
The statistical analysis conducted on geographies consisting of 170,629,617 people shows a poor negative correlation between the proportion of Iraqis and median male earnings in the United States with a correlation coefficient (R) of -0.188 and weighted average of $54,182. Similarly, the statistical analysis conducted on geographies consisting of 102,813,527 people shows a substantial negative correlation between the proportion of Tongans and median male earnings in the United States with a correlation coefficient (R) of -0.510 and weighted average of $53,218, a difference of 1.8%.
Median Male Earnings Correlation Summary
| Measurement | Iraqi | Tongan |
| Minimum | $31,325 | $26,442 |
| Maximum | $118,495 | $73,315 |
| Range | $87,170 | $46,873 |
| Mean | $54,518 | $48,593 |
| Median | $52,559 | $48,873 |
| Interquartile 25% (IQ1) | $45,816 | $42,778 |
| Interquartile 75% (IQ3) | $58,664 | $54,132 |
| Interquartile Range (IQR) | $12,848 | $11,354 |
| Standard Deviation (Sample) | $14,678 | $8,947 |
| Standard Deviation (Population) | $14,607 | $8,864 |
Demographics Similar to Iraqis and Tongans by Median Male Earnings
In terms of median male earnings, the demographic groups most similar to Iraqis are Immigrants ($54,168, a difference of 0.030%), Celtic ($54,242, a difference of 0.11%), Yugoslavian ($53,967, a difference of 0.40%), Immigrants from South America ($53,962, a difference of 0.41%), and White/Caucasian ($53,925, a difference of 0.48%). Similarly, the demographic groups most similar to Tongans are Immigrants from Costa Rica ($53,237, a difference of 0.030%), Immigrants from Kenya ($53,427, a difference of 0.39%), Immigrants from Africa ($53,457, a difference of 0.45%), Immigrants from the Azores ($53,503, a difference of 0.53%), and Spanish ($53,576, a difference of 0.67%).
| Demographics | Rating | Rank | Median Male Earnings |
| Celtics | 43.9 /100 | #179 | Average $54,242 |
| Iraqis | 42.5 /100 | #180 | Average $54,182 |
| Immigrants | Immigrants | 42.1 /100 | #181 | Average $54,168 |
| Yugoslavians | 37.4 /100 | #182 | Fair $53,967 |
| Immigrants | South America | 37.3 /100 | #183 | Fair $53,962 |
| Whites/Caucasians | 36.5 /100 | #184 | Fair $53,925 |
| Immigrants | Sierra Leone | 36.0 /100 | #185 | Fair $53,905 |
| Colombians | 34.4 /100 | #186 | Fair $53,832 |
| Immigrants | Eritrea | 31.8 /100 | #187 | Fair $53,715 |
| Immigrants | Eastern Africa | 31.8 /100 | #188 | Fair $53,713 |
| Puget Sound Salish | 31.6 /100 | #189 | Fair $53,704 |
| Uruguayans | 31.1 /100 | #190 | Fair $53,680 |
| Guamanians/Chamorros | 30.7 /100 | #191 | Fair $53,661 |
| Scotch-Irish | 30.6 /100 | #192 | Fair $53,658 |
| Kenyans | 30.4 /100 | #193 | Fair $53,647 |
| Spanish | 29.0 /100 | #194 | Fair $53,576 |
| Immigrants | Azores | 27.5 /100 | #195 | Fair $53,503 |
| Immigrants | Africa | 26.6 /100 | #196 | Fair $53,457 |
| Immigrants | Kenya | 26.0 /100 | #197 | Fair $53,427 |
| Immigrants | Costa Rica | 22.6 /100 | #198 | Fair $53,237 |
| Tongans | 22.3 /100 | #199 | Fair $53,218 |