Immigrants from Venezuela vs Tongan Median Male Earnings
COMPARE
Immigrants from Venezuela
Tongan
Median Male Earnings
Median Male Earnings Comparison
Immigrants from Venezuela
Tongans
$52,041
MEDIAN MALE EARNINGS
8.3/ 100
METRIC RATING
216th/ 347
METRIC RANK
$53,218
MEDIAN MALE EARNINGS
22.3/ 100
METRIC RATING
199th/ 347
METRIC RANK
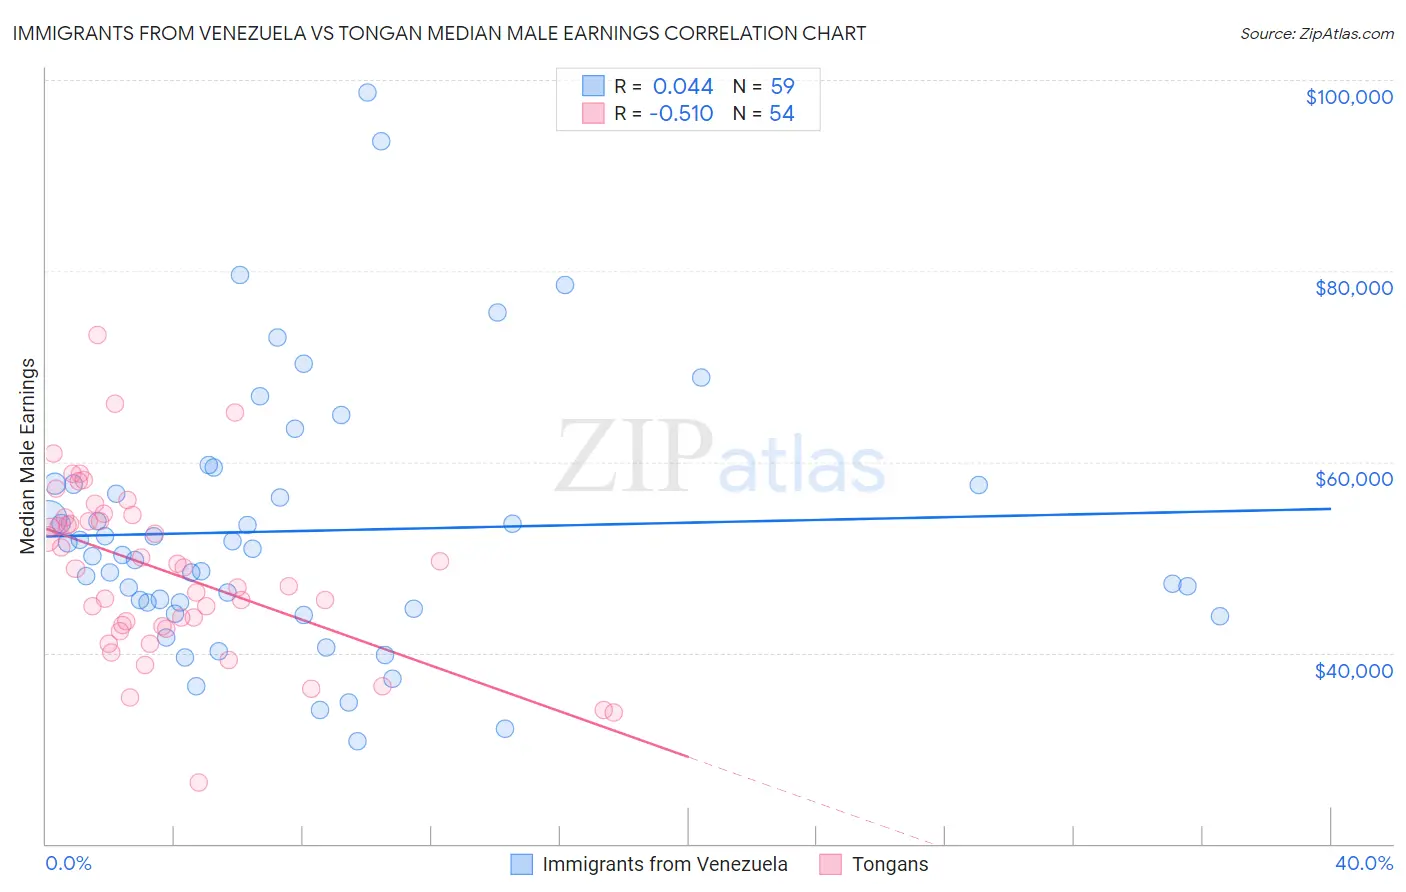
Immigrants from Venezuela vs Tongan Median Male Earnings Correlation Chart
The statistical analysis conducted on geographies consisting of 287,825,740 people shows no correlation between the proportion of Immigrants from Venezuela and median male earnings in the United States with a correlation coefficient (R) of 0.044 and weighted average of $52,041. Similarly, the statistical analysis conducted on geographies consisting of 102,813,527 people shows a substantial negative correlation between the proportion of Tongans and median male earnings in the United States with a correlation coefficient (R) of -0.510 and weighted average of $53,218, a difference of 2.3%.
Median Male Earnings Correlation Summary
| Measurement | Immigrants from Venezuela | Tongan |
| Minimum | $30,787 | $26,442 |
| Maximum | $98,656 | $73,315 |
| Range | $67,869 | $46,873 |
| Mean | $52,768 | $48,593 |
| Median | $50,259 | $48,873 |
| Interquartile 25% (IQ1) | $44,609 | $42,778 |
| Interquartile 75% (IQ3) | $57,648 | $54,132 |
| Interquartile Range (IQR) | $13,039 | $11,354 |
| Standard Deviation (Sample) | $13,735 | $8,947 |
| Standard Deviation (Population) | $13,618 | $8,864 |
Demographics Similar to Immigrants from Venezuela and Tongans by Median Male Earnings
In terms of median male earnings, the demographic groups most similar to Immigrants from Venezuela are Nigerian ($52,039, a difference of 0.0%), Immigrants from Cameroon ($52,119, a difference of 0.15%), Nonimmigrants ($52,170, a difference of 0.25%), Native Hawaiian ($52,306, a difference of 0.51%), and Cajun ($52,325, a difference of 0.55%). Similarly, the demographic groups most similar to Tongans are Immigrants from Costa Rica ($53,237, a difference of 0.030%), Immigrants from Kenya ($53,427, a difference of 0.39%), Immigrants from Thailand ($52,908, a difference of 0.59%), Immigrants from Bosnia and Herzegovina ($52,869, a difference of 0.66%), and Immigrants from Uruguay ($52,860, a difference of 0.68%).
| Demographics | Rating | Rank | Median Male Earnings |
| Immigrants | Kenya | 26.0 /100 | #197 | Fair $53,427 |
| Immigrants | Costa Rica | 22.6 /100 | #198 | Fair $53,237 |
| Tongans | 22.3 /100 | #199 | Fair $53,218 |
| Immigrants | Thailand | 17.5 /100 | #200 | Poor $52,908 |
| Immigrants | Bosnia and Herzegovina | 16.9 /100 | #201 | Poor $52,869 |
| Immigrants | Uruguay | 16.8 /100 | #202 | Poor $52,860 |
| Panamanians | 16.5 /100 | #203 | Poor $52,835 |
| Ghanaians | 16.1 /100 | #204 | Poor $52,810 |
| Immigrants | Colombia | 15.0 /100 | #205 | Poor $52,725 |
| Immigrants | Iraq | 14.5 /100 | #206 | Poor $52,681 |
| Vietnamese | 12.7 /100 | #207 | Poor $52,525 |
| Venezuelans | 12.5 /100 | #208 | Poor $52,510 |
| Bermudans | 12.1 /100 | #209 | Poor $52,465 |
| Delaware | 11.5 /100 | #210 | Poor $52,412 |
| Tlingit-Haida | 11.5 /100 | #211 | Poor $52,409 |
| Cajuns | 10.7 /100 | #212 | Poor $52,325 |
| Native Hawaiians | 10.5 /100 | #213 | Poor $52,306 |
| Immigrants | Nonimmigrants | 9.3 /100 | #214 | Tragic $52,170 |
| Immigrants | Cameroon | 8.9 /100 | #215 | Tragic $52,119 |
| Immigrants | Venezuela | 8.3 /100 | #216 | Tragic $52,041 |
| Nigerians | 8.3 /100 | #217 | Tragic $52,039 |