Danish vs Tongan Median Male Earnings
COMPARE
Danish
Tongan
Median Male Earnings
Median Male Earnings Comparison
Danes
Tongans
$56,246
MEDIAN MALE EARNINGS
84.8/ 100
METRIC RATING
141st/ 347
METRIC RANK
$53,218
MEDIAN MALE EARNINGS
22.3/ 100
METRIC RATING
199th/ 347
METRIC RANK
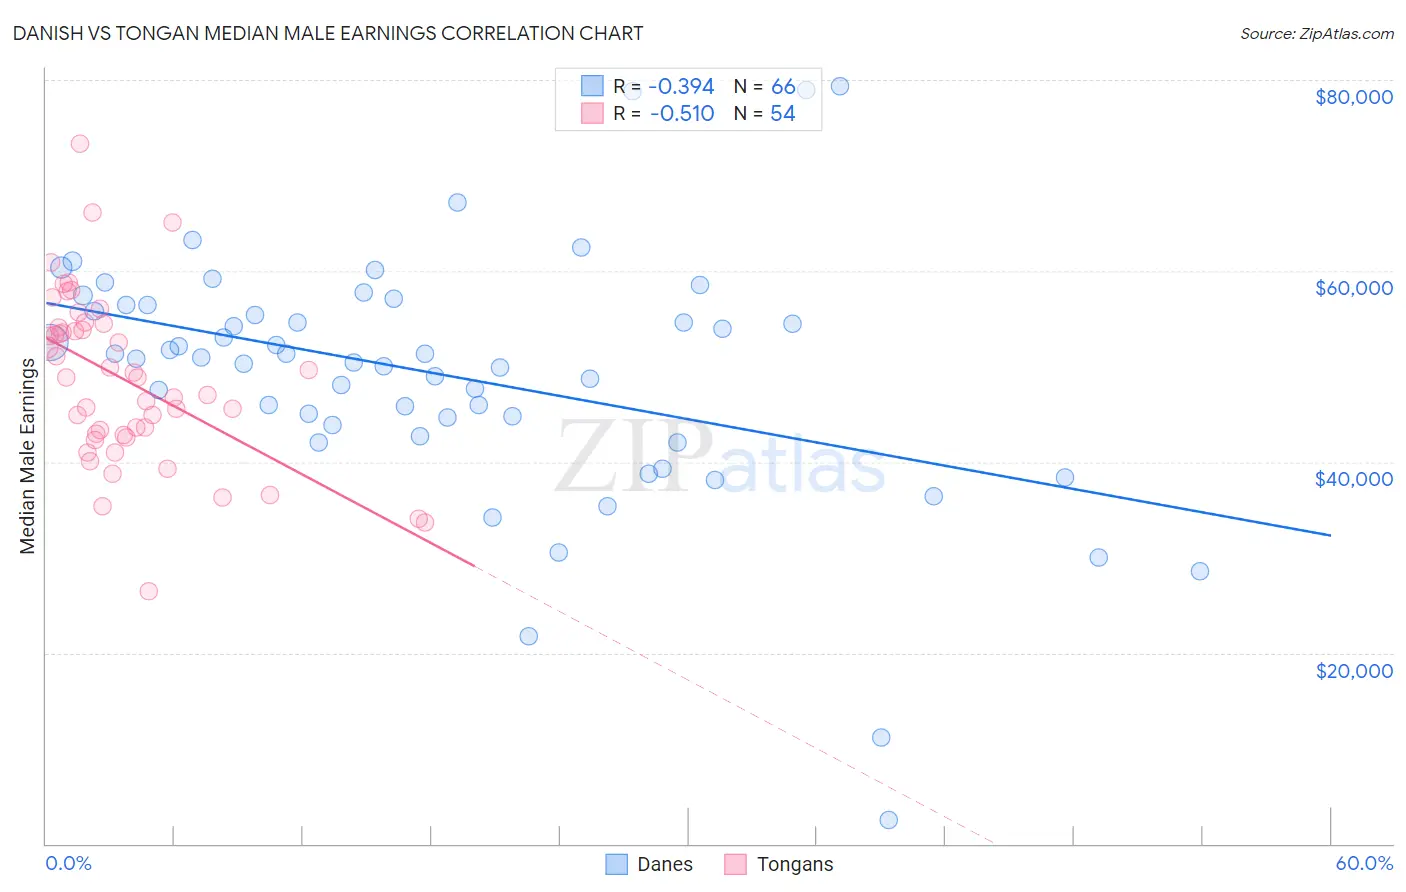
Danish vs Tongan Median Male Earnings Correlation Chart
The statistical analysis conducted on geographies consisting of 473,826,770 people shows a mild negative correlation between the proportion of Danes and median male earnings in the United States with a correlation coefficient (R) of -0.394 and weighted average of $56,246. Similarly, the statistical analysis conducted on geographies consisting of 102,813,527 people shows a substantial negative correlation between the proportion of Tongans and median male earnings in the United States with a correlation coefficient (R) of -0.510 and weighted average of $53,218, a difference of 5.7%.
Median Male Earnings Correlation Summary
| Measurement | Danish | Tongan |
| Minimum | $2,499 | $26,442 |
| Maximum | $79,323 | $73,315 |
| Range | $76,824 | $46,873 |
| Mean | $49,129 | $48,593 |
| Median | $50,861 | $48,873 |
| Interquartile 25% (IQ1) | $43,822 | $42,778 |
| Interquartile 75% (IQ3) | $56,381 | $54,132 |
| Interquartile Range (IQR) | $12,560 | $11,354 |
| Standard Deviation (Sample) | $13,278 | $8,947 |
| Standard Deviation (Population) | $13,177 | $8,864 |
Similar Demographics by Median Male Earnings
Demographics Similar to Danes by Median Male Earnings
In terms of median male earnings, the demographic groups most similar to Danes are Ethiopian ($56,243, a difference of 0.0%), Zimbabwean ($56,302, a difference of 0.10%), Luxembourger ($56,300, a difference of 0.10%), Slovak ($56,306, a difference of 0.11%), and Sri Lankan ($56,136, a difference of 0.19%).
| Demographics | Rating | Rank | Median Male Earnings |
| Moroccans | 87.7 /100 | #134 | Excellent $56,499 |
| Irish | 87.4 /100 | #135 | Excellent $56,464 |
| Immigrants | Saudi Arabia | 87.2 /100 | #136 | Excellent $56,452 |
| Slavs | 86.5 /100 | #137 | Excellent $56,390 |
| Slovaks | 85.5 /100 | #138 | Excellent $56,306 |
| Zimbabweans | 85.5 /100 | #139 | Excellent $56,302 |
| Luxembourgers | 85.5 /100 | #140 | Excellent $56,300 |
| Danes | 84.8 /100 | #141 | Excellent $56,246 |
| Ethiopians | 84.8 /100 | #142 | Excellent $56,243 |
| Sri Lankans | 83.4 /100 | #143 | Excellent $56,136 |
| Immigrants | Uganda | 82.4 /100 | #144 | Excellent $56,064 |
| Norwegians | 80.9 /100 | #145 | Excellent $55,965 |
| Immigrants | Chile | 80.7 /100 | #146 | Excellent $55,954 |
| Immigrants | Philippines | 78.4 /100 | #147 | Good $55,809 |
| Scottish | 78.2 /100 | #148 | Good $55,793 |
Demographics Similar to Tongans by Median Male Earnings
In terms of median male earnings, the demographic groups most similar to Tongans are Immigrants from Costa Rica ($53,237, a difference of 0.030%), Immigrants from Kenya ($53,427, a difference of 0.39%), Immigrants from Africa ($53,457, a difference of 0.45%), Immigrants from the Azores ($53,503, a difference of 0.53%), and Immigrants from Thailand ($52,908, a difference of 0.59%).
| Demographics | Rating | Rank | Median Male Earnings |
| Scotch-Irish | 30.6 /100 | #192 | Fair $53,658 |
| Kenyans | 30.4 /100 | #193 | Fair $53,647 |
| Spanish | 29.0 /100 | #194 | Fair $53,576 |
| Immigrants | Azores | 27.5 /100 | #195 | Fair $53,503 |
| Immigrants | Africa | 26.6 /100 | #196 | Fair $53,457 |
| Immigrants | Kenya | 26.0 /100 | #197 | Fair $53,427 |
| Immigrants | Costa Rica | 22.6 /100 | #198 | Fair $53,237 |
| Tongans | 22.3 /100 | #199 | Fair $53,218 |
| Immigrants | Thailand | 17.5 /100 | #200 | Poor $52,908 |
| Immigrants | Bosnia and Herzegovina | 16.9 /100 | #201 | Poor $52,869 |
| Immigrants | Uruguay | 16.8 /100 | #202 | Poor $52,860 |
| Panamanians | 16.5 /100 | #203 | Poor $52,835 |
| Ghanaians | 16.1 /100 | #204 | Poor $52,810 |
| Immigrants | Colombia | 15.0 /100 | #205 | Poor $52,725 |
| Immigrants | Iraq | 14.5 /100 | #206 | Poor $52,681 |