Israeli vs Egyptian Per Capita Income
COMPARE
Israeli
Egyptian
Per Capita Income
Per Capita Income Comparison
Israelis
Egyptians
$52,596
PER CAPITA INCOME
100.0/ 100
METRIC RATING
29th/ 347
METRIC RANK
$48,358
PER CAPITA INCOME
99.5/ 100
METRIC RATING
80th/ 347
METRIC RANK
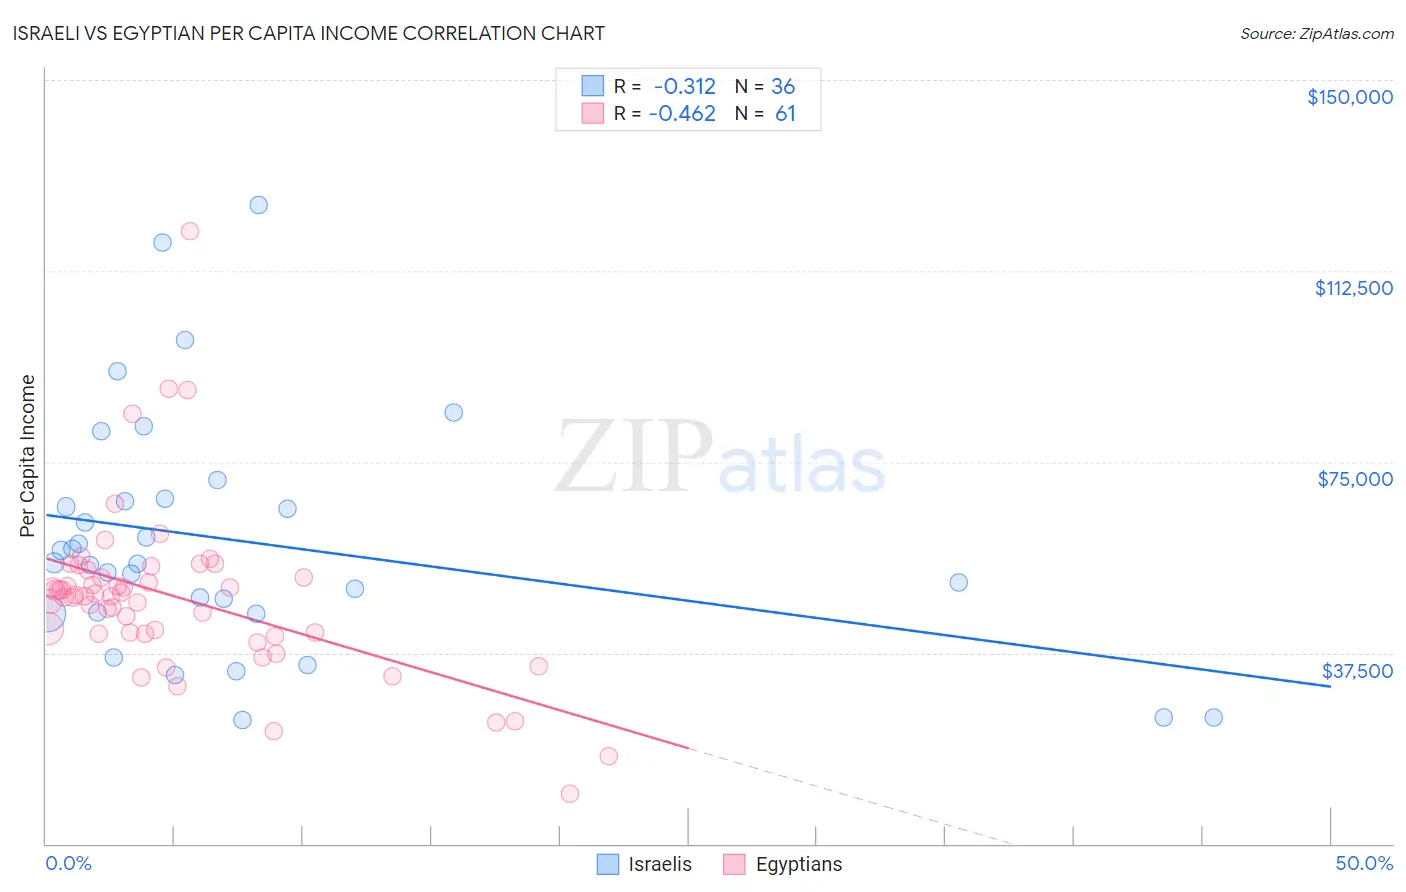
Israeli vs Egyptian Per Capita Income Correlation Chart
The statistical analysis conducted on geographies consisting of 211,224,844 people shows a mild negative correlation between the proportion of Israelis and per capita income in the United States with a correlation coefficient (R) of -0.312 and weighted average of $52,596. Similarly, the statistical analysis conducted on geographies consisting of 276,936,692 people shows a moderate negative correlation between the proportion of Egyptians and per capita income in the United States with a correlation coefficient (R) of -0.462 and weighted average of $48,358, a difference of 8.8%.
Per Capita Income Correlation Summary
| Measurement | Israeli | Egyptian |
| Minimum | $24,292 | $9,805 |
| Maximum | $125,412 | $120,225 |
| Range | $101,120 | $110,420 |
| Mean | $59,345 | $48,391 |
| Median | $55,064 | $48,690 |
| Interquartile 25% (IQ1) | $45,317 | $41,170 |
| Interquartile 75% (IQ3) | $67,525 | $53,076 |
| Interquartile Range (IQR) | $22,208 | $11,906 |
| Standard Deviation (Sample) | $23,722 | $16,881 |
| Standard Deviation (Population) | $23,390 | $16,742 |
Similar Demographics by Per Capita Income
Demographics Similar to Israelis by Per Capita Income
In terms of per capita income, the demographic groups most similar to Israelis are Latvian ($52,649, a difference of 0.10%), Immigrants from South Central Asia ($52,660, a difference of 0.12%), Immigrants from Austria ($52,503, a difference of 0.18%), Turkish ($52,391, a difference of 0.39%), and Immigrants from Norway ($52,217, a difference of 0.73%).
| Demographics | Rating | Rank | Per Capita Income |
| Indians (Asian) | 100.0 /100 | #22 | Exceptional $53,874 |
| Immigrants | Eastern Asia | 100.0 /100 | #23 | Exceptional $53,806 |
| Immigrants | Denmark | 100.0 /100 | #24 | Exceptional $53,799 |
| Immigrants | Japan | 100.0 /100 | #25 | Exceptional $53,359 |
| Russians | 100.0 /100 | #26 | Exceptional $53,154 |
| Immigrants | South Central Asia | 100.0 /100 | #27 | Exceptional $52,660 |
| Latvians | 100.0 /100 | #28 | Exceptional $52,649 |
| Israelis | 100.0 /100 | #29 | Exceptional $52,596 |
| Immigrants | Austria | 100.0 /100 | #30 | Exceptional $52,503 |
| Turks | 100.0 /100 | #31 | Exceptional $52,391 |
| Immigrants | Norway | 100.0 /100 | #32 | Exceptional $52,217 |
| Australians | 100.0 /100 | #33 | Exceptional $52,074 |
| Immigrants | Russia | 100.0 /100 | #34 | Exceptional $52,044 |
| Burmese | 100.0 /100 | #35 | Exceptional $52,005 |
| Immigrants | Greece | 100.0 /100 | #36 | Exceptional $51,891 |
Demographics Similar to Egyptians by Per Capita Income
In terms of per capita income, the demographic groups most similar to Egyptians are Armenian ($48,287, a difference of 0.15%), Romanian ($48,445, a difference of 0.18%), Immigrants from Indonesia ($48,195, a difference of 0.34%), Immigrants from Brazil ($48,164, a difference of 0.40%), and Immigrants from Ukraine ($48,134, a difference of 0.46%).
| Demographics | Rating | Rank | Per Capita Income |
| Immigrants | North America | 99.8 /100 | #73 | Exceptional $49,302 |
| Mongolians | 99.8 /100 | #74 | Exceptional $49,173 |
| Immigrants | Bolivia | 99.7 /100 | #75 | Exceptional $48,970 |
| Immigrants | England | 99.7 /100 | #76 | Exceptional $48,844 |
| Immigrants | Kazakhstan | 99.7 /100 | #77 | Exceptional $48,747 |
| Immigrants | Italy | 99.6 /100 | #78 | Exceptional $48,654 |
| Romanians | 99.5 /100 | #79 | Exceptional $48,445 |
| Egyptians | 99.5 /100 | #80 | Exceptional $48,358 |
| Armenians | 99.4 /100 | #81 | Exceptional $48,287 |
| Immigrants | Indonesia | 99.4 /100 | #82 | Exceptional $48,195 |
| Immigrants | Brazil | 99.4 /100 | #83 | Exceptional $48,164 |
| Immigrants | Ukraine | 99.3 /100 | #84 | Exceptional $48,134 |
| Austrians | 99.3 /100 | #85 | Exceptional $48,116 |
| Immigrants | Southern Europe | 99.3 /100 | #86 | Exceptional $48,027 |
| Ukrainians | 99.3 /100 | #87 | Exceptional $48,014 |