Israeli vs Immigrants from Eritrea Median Household Income
COMPARE
Israeli
Immigrants from Eritrea
Median Household Income
Median Household Income Comparison
Israelis
Immigrants from Eritrea
$96,552
MEDIAN HOUSEHOLD INCOME
99.9/ 100
METRIC RATING
45th/ 347
METRIC RANK
$85,025
MEDIAN HOUSEHOLD INCOME
48.8/ 100
METRIC RATING
177th/ 347
METRIC RANK
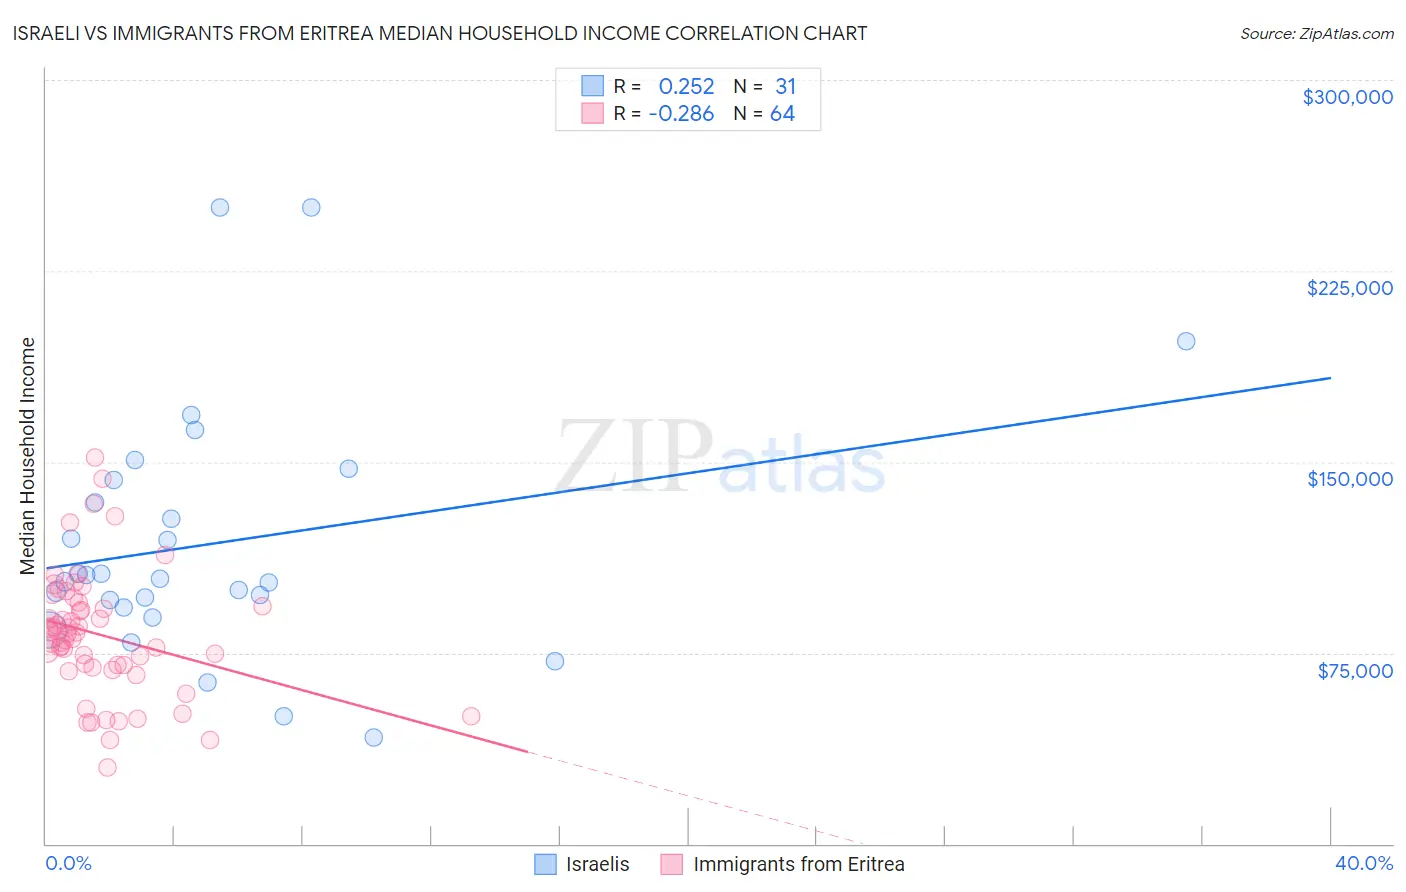
Israeli vs Immigrants from Eritrea Median Household Income Correlation Chart
The statistical analysis conducted on geographies consisting of 210,971,551 people shows a weak positive correlation between the proportion of Israelis and median household income in the United States with a correlation coefficient (R) of 0.252 and weighted average of $96,552. Similarly, the statistical analysis conducted on geographies consisting of 104,846,826 people shows a weak negative correlation between the proportion of Immigrants from Eritrea and median household income in the United States with a correlation coefficient (R) of -0.286 and weighted average of $85,025, a difference of 13.6%.
Median Household Income Correlation Summary
| Measurement | Israeli | Immigrants from Eritrea |
| Minimum | $41,875 | $29,732 |
| Maximum | $250,001 | $151,475 |
| Range | $208,126 | $121,743 |
| Mean | $117,996 | $82,120 |
| Median | $104,190 | $82,729 |
| Interquartile 25% (IQ1) | $92,986 | $69,674 |
| Interquartile 75% (IQ3) | $142,824 | $94,044 |
| Interquartile Range (IQR) | $49,838 | $24,370 |
| Standard Deviation (Sample) | $48,790 | $24,340 |
| Standard Deviation (Population) | $47,997 | $24,149 |
Similar Demographics by Median Household Income
Demographics Similar to Israelis by Median Household Income
In terms of median household income, the demographic groups most similar to Israelis are Australian ($96,490, a difference of 0.060%), Immigrants from Greece ($96,675, a difference of 0.13%), Immigrants from Russia ($96,378, a difference of 0.18%), Immigrants from France ($96,743, a difference of 0.20%), and Cambodian ($96,324, a difference of 0.24%).
| Demographics | Rating | Rank | Median Household Income |
| Immigrants | Indonesia | 100.0 /100 | #38 | Exceptional $97,297 |
| Afghans | 100.0 /100 | #39 | Exceptional $97,026 |
| Maltese | 100.0 /100 | #40 | Exceptional $97,015 |
| Immigrants | Turkey | 100.0 /100 | #41 | Exceptional $96,964 |
| Immigrants | Lithuania | 99.9 /100 | #42 | Exceptional $96,836 |
| Immigrants | France | 99.9 /100 | #43 | Exceptional $96,743 |
| Immigrants | Greece | 99.9 /100 | #44 | Exceptional $96,675 |
| Israelis | 99.9 /100 | #45 | Exceptional $96,552 |
| Australians | 99.9 /100 | #46 | Exceptional $96,490 |
| Immigrants | Russia | 99.9 /100 | #47 | Exceptional $96,378 |
| Cambodians | 99.9 /100 | #48 | Exceptional $96,324 |
| Immigrants | Malaysia | 99.9 /100 | #49 | Exceptional $96,292 |
| Bulgarians | 99.9 /100 | #50 | Exceptional $96,290 |
| Estonians | 99.9 /100 | #51 | Exceptional $95,930 |
| Immigrants | South Africa | 99.9 /100 | #52 | Exceptional $95,800 |
Demographics Similar to Immigrants from Eritrea by Median Household Income
In terms of median household income, the demographic groups most similar to Immigrants from Eritrea are Immigrants from Costa Rica ($85,054, a difference of 0.030%), Alsatian ($85,053, a difference of 0.030%), Czechoslovakian ($84,965, a difference of 0.070%), Scottish ($85,101, a difference of 0.090%), and English ($84,915, a difference of 0.13%).
| Demographics | Rating | Rank | Median Household Income |
| Swiss | 59.2 /100 | #170 | Average $85,681 |
| Immigrants | South America | 58.1 /100 | #171 | Average $85,611 |
| Slovenes | 57.4 /100 | #172 | Average $85,562 |
| Immigrants | Cameroon | 53.4 /100 | #173 | Average $85,314 |
| Scottish | 50.0 /100 | #174 | Average $85,101 |
| Immigrants | Costa Rica | 49.2 /100 | #175 | Average $85,054 |
| Alsatians | 49.2 /100 | #176 | Average $85,053 |
| Immigrants | Eritrea | 48.8 /100 | #177 | Average $85,025 |
| Czechoslovakians | 47.8 /100 | #178 | Average $84,965 |
| English | 47.0 /100 | #179 | Average $84,915 |
| Immigrants | Portugal | 44.2 /100 | #180 | Average $84,740 |
| Hawaiians | 44.1 /100 | #181 | Average $84,729 |
| Uruguayans | 43.5 /100 | #182 | Average $84,691 |
| Spaniards | 42.7 /100 | #183 | Average $84,644 |
| Immigrants | Eastern Africa | 37.4 /100 | #184 | Fair $84,299 |