Israeli vs Cajun Per Capita Income
COMPARE
Israeli
Cajun
Per Capita Income
Per Capita Income Comparison
Israelis
Cajuns
$52,596
PER CAPITA INCOME
100.0/ 100
METRIC RATING
29th/ 347
METRIC RANK
$37,527
PER CAPITA INCOME
0.1/ 100
METRIC RATING
291st/ 347
METRIC RANK
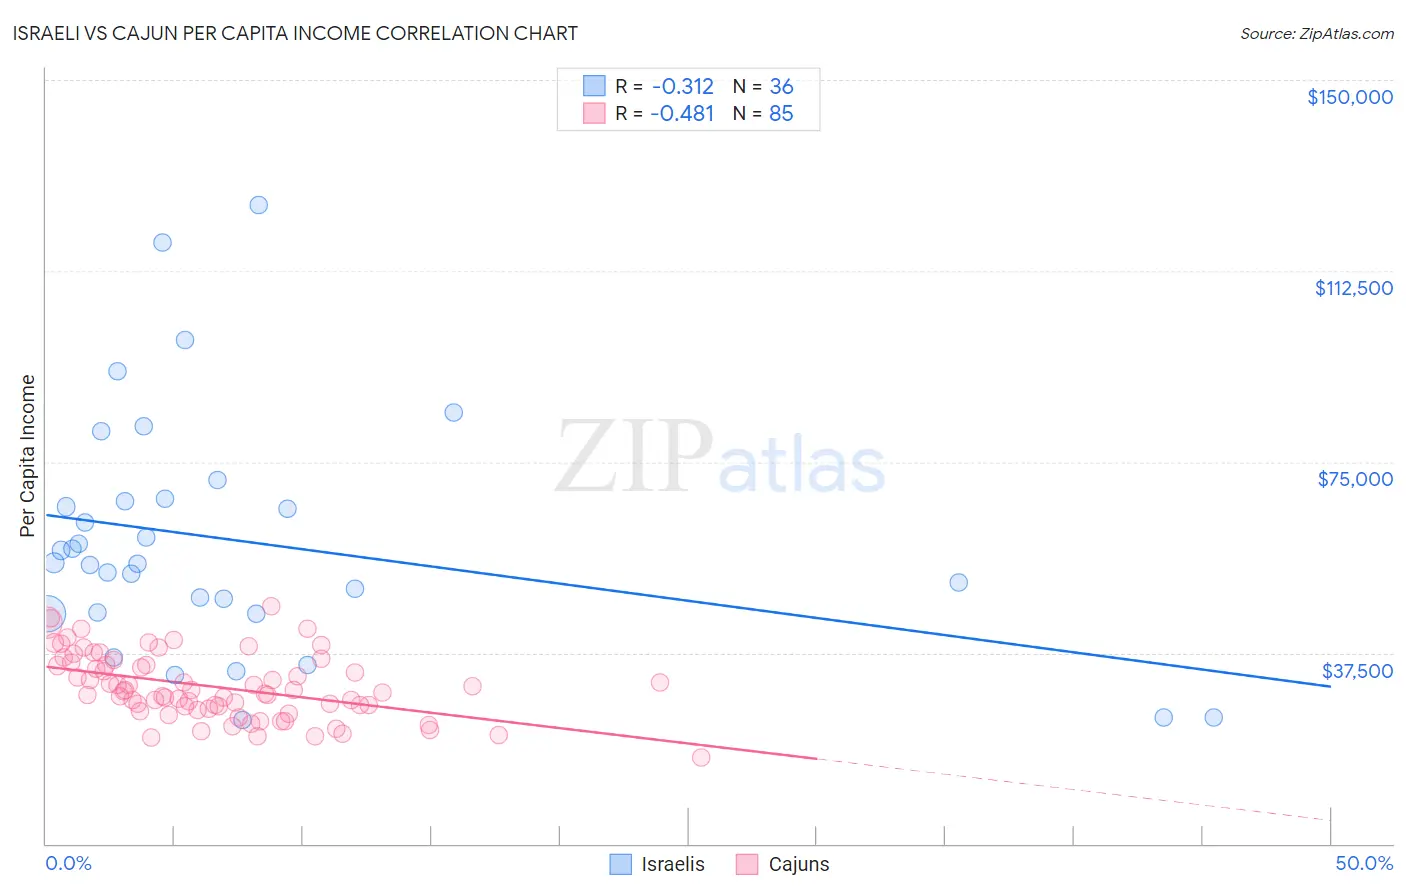
Israeli vs Cajun Per Capita Income Correlation Chart
The statistical analysis conducted on geographies consisting of 211,224,844 people shows a mild negative correlation between the proportion of Israelis and per capita income in the United States with a correlation coefficient (R) of -0.312 and weighted average of $52,596. Similarly, the statistical analysis conducted on geographies consisting of 149,712,942 people shows a moderate negative correlation between the proportion of Cajuns and per capita income in the United States with a correlation coefficient (R) of -0.481 and weighted average of $37,527, a difference of 40.2%.
Per Capita Income Correlation Summary
| Measurement | Israeli | Cajun |
| Minimum | $24,292 | $16,891 |
| Maximum | $125,412 | $46,697 |
| Range | $101,120 | $29,806 |
| Mean | $59,345 | $30,817 |
| Median | $55,064 | $29,870 |
| Interquartile 25% (IQ1) | $45,317 | $26,822 |
| Interquartile 75% (IQ3) | $67,525 | $35,445 |
| Interquartile Range (IQR) | $22,208 | $8,623 |
| Standard Deviation (Sample) | $23,722 | $6,316 |
| Standard Deviation (Population) | $23,390 | $6,279 |
Similar Demographics by Per Capita Income
Demographics Similar to Israelis by Per Capita Income
In terms of per capita income, the demographic groups most similar to Israelis are Latvian ($52,649, a difference of 0.10%), Immigrants from South Central Asia ($52,660, a difference of 0.12%), Immigrants from Austria ($52,503, a difference of 0.18%), Turkish ($52,391, a difference of 0.39%), and Immigrants from Norway ($52,217, a difference of 0.73%).
| Demographics | Rating | Rank | Per Capita Income |
| Indians (Asian) | 100.0 /100 | #22 | Exceptional $53,874 |
| Immigrants | Eastern Asia | 100.0 /100 | #23 | Exceptional $53,806 |
| Immigrants | Denmark | 100.0 /100 | #24 | Exceptional $53,799 |
| Immigrants | Japan | 100.0 /100 | #25 | Exceptional $53,359 |
| Russians | 100.0 /100 | #26 | Exceptional $53,154 |
| Immigrants | South Central Asia | 100.0 /100 | #27 | Exceptional $52,660 |
| Latvians | 100.0 /100 | #28 | Exceptional $52,649 |
| Israelis | 100.0 /100 | #29 | Exceptional $52,596 |
| Immigrants | Austria | 100.0 /100 | #30 | Exceptional $52,503 |
| Turks | 100.0 /100 | #31 | Exceptional $52,391 |
| Immigrants | Norway | 100.0 /100 | #32 | Exceptional $52,217 |
| Australians | 100.0 /100 | #33 | Exceptional $52,074 |
| Immigrants | Russia | 100.0 /100 | #34 | Exceptional $52,044 |
| Burmese | 100.0 /100 | #35 | Exceptional $52,005 |
| Immigrants | Greece | 100.0 /100 | #36 | Exceptional $51,891 |
Demographics Similar to Cajuns by Per Capita Income
In terms of per capita income, the demographic groups most similar to Cajuns are Immigrants from Guatemala ($37,550, a difference of 0.060%), U.S. Virgin Islander ($37,589, a difference of 0.16%), Immigrants from Micronesia ($37,464, a difference of 0.17%), Mexican American Indian ($37,407, a difference of 0.32%), and Cuban ($37,383, a difference of 0.39%).
| Demographics | Rating | Rank | Per Capita Income |
| Africans | 0.1 /100 | #284 | Tragic $37,785 |
| Guatemalans | 0.1 /100 | #285 | Tragic $37,766 |
| Central American Indians | 0.1 /100 | #286 | Tragic $37,699 |
| Dominicans | 0.1 /100 | #287 | Tragic $37,697 |
| Blackfeet | 0.1 /100 | #288 | Tragic $37,695 |
| U.S. Virgin Islanders | 0.1 /100 | #289 | Tragic $37,589 |
| Immigrants | Guatemala | 0.1 /100 | #290 | Tragic $37,550 |
| Cajuns | 0.1 /100 | #291 | Tragic $37,527 |
| Immigrants | Micronesia | 0.1 /100 | #292 | Tragic $37,464 |
| Mexican American Indians | 0.1 /100 | #293 | Tragic $37,407 |
| Cubans | 0.1 /100 | #294 | Tragic $37,383 |
| Immigrants | Dominican Republic | 0.1 /100 | #295 | Tragic $37,306 |
| Indonesians | 0.1 /100 | #296 | Tragic $37,300 |
| Haitians | 0.1 /100 | #297 | Tragic $37,289 |
| Immigrants | Caribbean | 0.1 /100 | #298 | Tragic $37,254 |