Immigrants from Western Asia vs Brazilian Median Earnings
COMPARE
Immigrants from Western Asia
Brazilian
Median Earnings
Median Earnings Comparison
Immigrants from Western Asia
Brazilians
$49,389
MEDIAN EARNINGS
98.4/ 100
METRIC RATING
105th/ 347
METRIC RANK
$48,356
MEDIAN EARNINGS
93.7/ 100
METRIC RATING
124th/ 347
METRIC RANK
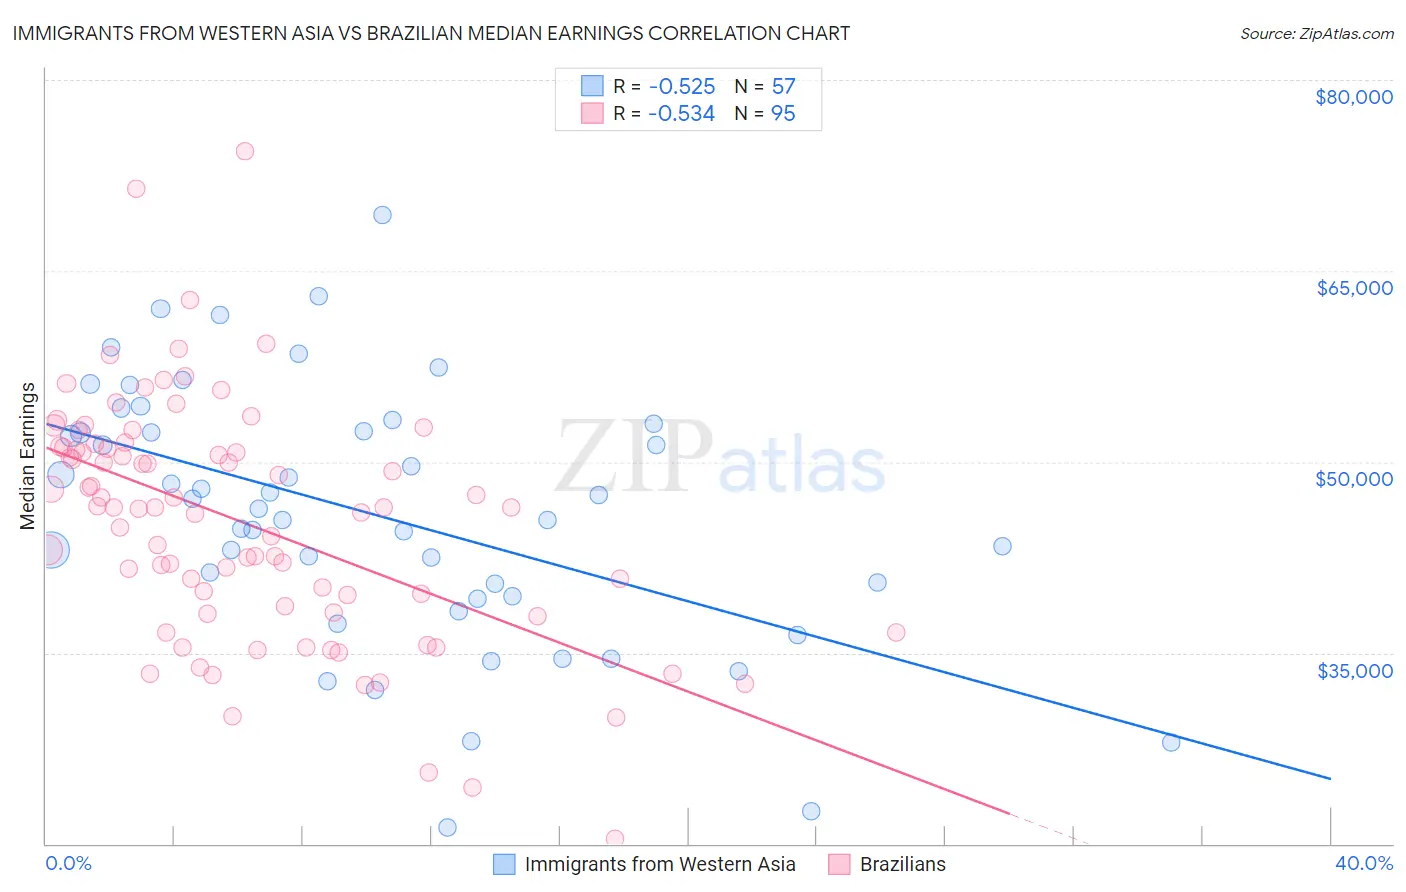
Immigrants from Western Asia vs Brazilian Median Earnings Correlation Chart
The statistical analysis conducted on geographies consisting of 404,426,866 people shows a substantial negative correlation between the proportion of Immigrants from Western Asia and median earnings in the United States with a correlation coefficient (R) of -0.525 and weighted average of $49,389. Similarly, the statistical analysis conducted on geographies consisting of 323,957,574 people shows a substantial negative correlation between the proportion of Brazilians and median earnings in the United States with a correlation coefficient (R) of -0.534 and weighted average of $48,356, a difference of 2.1%.
Median Earnings Correlation Summary
| Measurement | Immigrants from Western Asia | Brazilian |
| Minimum | $21,250 | $20,417 |
| Maximum | $69,348 | $74,375 |
| Range | $48,098 | $53,958 |
| Mean | $45,817 | $45,246 |
| Median | $46,307 | $46,406 |
| Interquartile 25% (IQ1) | $39,374 | $38,216 |
| Interquartile 75% (IQ3) | $52,673 | $51,116 |
| Interquartile Range (IQR) | $13,299 | $12,900 |
| Standard Deviation (Sample) | $10,167 | $9,424 |
| Standard Deviation (Population) | $10,077 | $9,375 |
Demographics Similar to Immigrants from Western Asia and Brazilians by Median Earnings
In terms of median earnings, the demographic groups most similar to Immigrants from Western Asia are Immigrants from Albania ($49,377, a difference of 0.020%), Immigrants from Morocco ($49,368, a difference of 0.040%), Immigrants from Brazil ($49,463, a difference of 0.15%), Palestinian ($49,209, a difference of 0.37%), and Syrian ($48,934, a difference of 0.93%). Similarly, the demographic groups most similar to Brazilians are Immigrants from Syria ($48,375, a difference of 0.040%), Chilean ($48,504, a difference of 0.31%), Arab ($48,599, a difference of 0.50%), Carpatho Rusyn ($48,617, a difference of 0.54%), and Polish ($48,659, a difference of 0.63%).
| Demographics | Rating | Rank | Median Earnings |
| Immigrants | Brazil | 98.6 /100 | #104 | Exceptional $49,463 |
| Immigrants | Western Asia | 98.4 /100 | #105 | Exceptional $49,389 |
| Immigrants | Albania | 98.4 /100 | #106 | Exceptional $49,377 |
| Immigrants | Morocco | 98.4 /100 | #107 | Exceptional $49,368 |
| Palestinians | 98.0 /100 | #108 | Exceptional $49,209 |
| Syrians | 97.1 /100 | #109 | Exceptional $48,934 |
| Immigrants | Ethiopia | 97.1 /100 | #110 | Exceptional $48,924 |
| Immigrants | Zimbabwe | 97.0 /100 | #111 | Exceptional $48,913 |
| Northern Europeans | 96.9 /100 | #112 | Exceptional $48,887 |
| Immigrants | Kuwait | 96.8 /100 | #113 | Exceptional $48,861 |
| Moroccans | 96.7 /100 | #114 | Exceptional $48,838 |
| Chinese | 96.7 /100 | #115 | Exceptional $48,836 |
| Koreans | 96.2 /100 | #116 | Exceptional $48,727 |
| Serbians | 95.9 /100 | #117 | Exceptional $48,677 |
| Immigrants | Jordan | 95.9 /100 | #118 | Exceptional $48,673 |
| Poles | 95.8 /100 | #119 | Exceptional $48,659 |
| Carpatho Rusyns | 95.5 /100 | #120 | Exceptional $48,617 |
| Arabs | 95.4 /100 | #121 | Exceptional $48,599 |
| Chileans | 94.8 /100 | #122 | Exceptional $48,504 |
| Immigrants | Syria | 93.9 /100 | #123 | Exceptional $48,375 |
| Brazilians | 93.7 /100 | #124 | Exceptional $48,356 |