Immigrants from Western Asia vs Lumbee Median Earnings
COMPARE
Immigrants from Western Asia
Lumbee
Median Earnings
Median Earnings Comparison
Immigrants from Western Asia
Lumbee
$49,389
MEDIAN EARNINGS
98.4/ 100
METRIC RATING
105th/ 347
METRIC RANK
$36,876
MEDIAN EARNINGS
0.0/ 100
METRIC RATING
341st/ 347
METRIC RANK
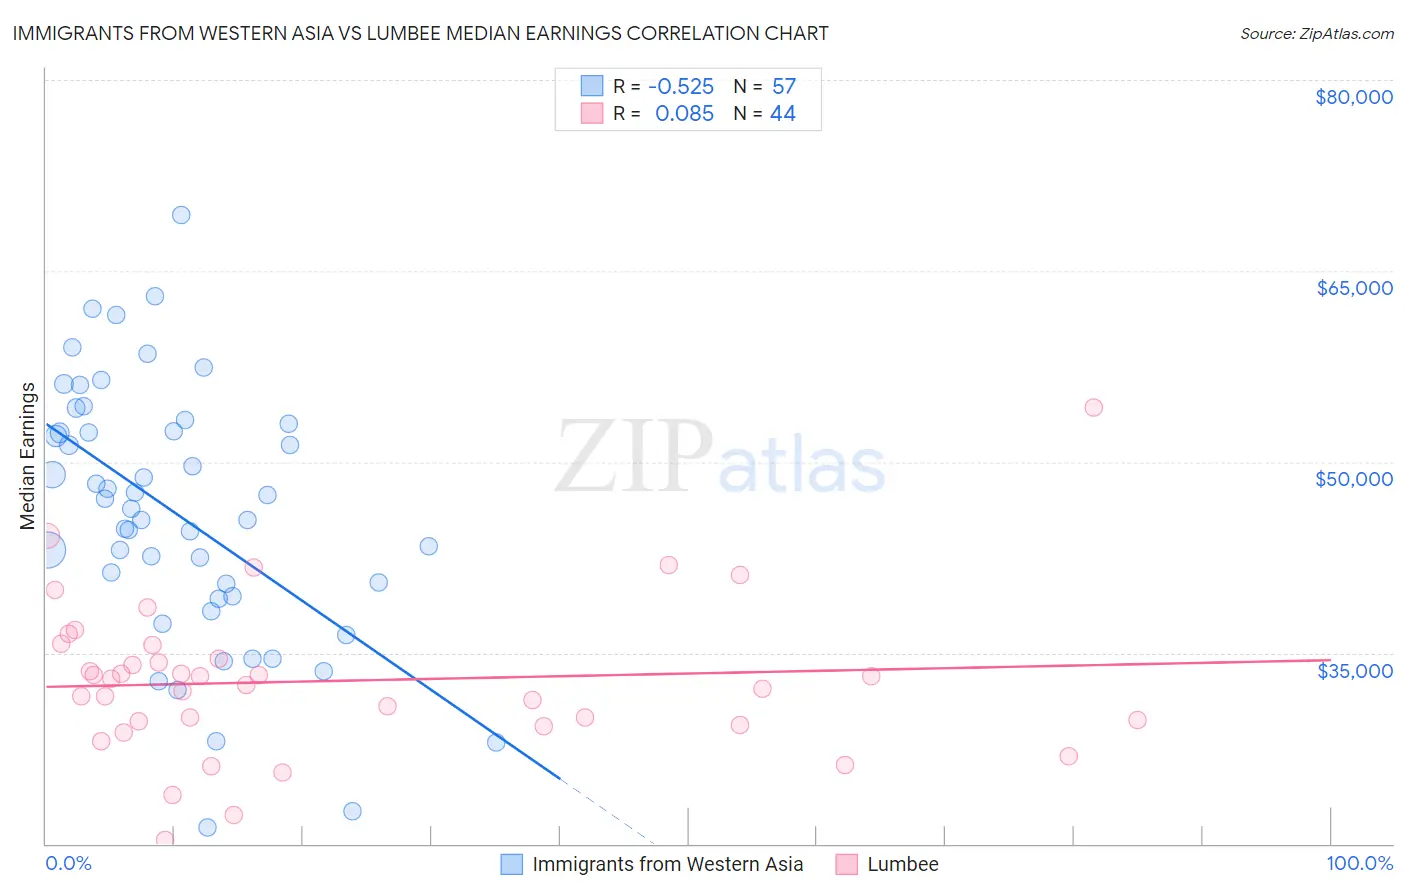
Immigrants from Western Asia vs Lumbee Median Earnings Correlation Chart
The statistical analysis conducted on geographies consisting of 404,426,866 people shows a substantial negative correlation between the proportion of Immigrants from Western Asia and median earnings in the United States with a correlation coefficient (R) of -0.525 and weighted average of $49,389. Similarly, the statistical analysis conducted on geographies consisting of 92,282,036 people shows a slight positive correlation between the proportion of Lumbee and median earnings in the United States with a correlation coefficient (R) of 0.085 and weighted average of $36,876, a difference of 33.9%.
Median Earnings Correlation Summary
| Measurement | Immigrants from Western Asia | Lumbee |
| Minimum | $21,250 | $20,337 |
| Maximum | $69,348 | $54,265 |
| Range | $48,098 | $33,928 |
| Mean | $45,817 | $32,791 |
| Median | $46,307 | $32,724 |
| Interquartile 25% (IQ1) | $39,374 | $29,449 |
| Interquartile 75% (IQ3) | $52,673 | $35,034 |
| Interquartile Range (IQR) | $13,299 | $5,585 |
| Standard Deviation (Sample) | $10,167 | $6,085 |
| Standard Deviation (Population) | $10,077 | $6,015 |
Similar Demographics by Median Earnings
Demographics Similar to Immigrants from Western Asia by Median Earnings
In terms of median earnings, the demographic groups most similar to Immigrants from Western Asia are Immigrants from Albania ($49,377, a difference of 0.020%), Immigrants from Morocco ($49,368, a difference of 0.040%), Immigrants from Brazil ($49,463, a difference of 0.15%), Austrian ($49,501, a difference of 0.23%), and Ethiopian ($49,572, a difference of 0.37%).
| Demographics | Rating | Rank | Median Earnings |
| Immigrants | Northern Africa | 98.9 /100 | #98 | Exceptional $49,648 |
| Immigrants | Afghanistan | 98.9 /100 | #99 | Exceptional $49,645 |
| Immigrants | Poland | 98.9 /100 | #100 | Exceptional $49,633 |
| Jordanians | 98.9 /100 | #101 | Exceptional $49,632 |
| Ethiopians | 98.8 /100 | #102 | Exceptional $49,572 |
| Austrians | 98.7 /100 | #103 | Exceptional $49,501 |
| Immigrants | Brazil | 98.6 /100 | #104 | Exceptional $49,463 |
| Immigrants | Western Asia | 98.4 /100 | #105 | Exceptional $49,389 |
| Immigrants | Albania | 98.4 /100 | #106 | Exceptional $49,377 |
| Immigrants | Morocco | 98.4 /100 | #107 | Exceptional $49,368 |
| Palestinians | 98.0 /100 | #108 | Exceptional $49,209 |
| Syrians | 97.1 /100 | #109 | Exceptional $48,934 |
| Immigrants | Ethiopia | 97.1 /100 | #110 | Exceptional $48,924 |
| Immigrants | Zimbabwe | 97.0 /100 | #111 | Exceptional $48,913 |
| Northern Europeans | 96.9 /100 | #112 | Exceptional $48,887 |
Demographics Similar to Lumbee by Median Earnings
In terms of median earnings, the demographic groups most similar to Lumbee are Hopi ($36,871, a difference of 0.010%), Pueblo ($36,859, a difference of 0.050%), Navajo ($36,999, a difference of 0.33%), Arapaho ($36,586, a difference of 0.79%), and Tohono O'odham ($36,349, a difference of 1.5%).
| Demographics | Rating | Rank | Median Earnings |
| Houma | 0.0 /100 | #333 | Tragic $38,949 |
| Spanish American Indians | 0.0 /100 | #334 | Tragic $38,907 |
| Natives/Alaskans | 0.0 /100 | #335 | Tragic $38,896 |
| Crow | 0.0 /100 | #336 | Tragic $38,707 |
| Immigrants | Cuba | 0.0 /100 | #337 | Tragic $38,426 |
| Pima | 0.0 /100 | #338 | Tragic $38,285 |
| Menominee | 0.0 /100 | #339 | Tragic $37,884 |
| Navajo | 0.0 /100 | #340 | Tragic $36,999 |
| Lumbee | 0.0 /100 | #341 | Tragic $36,876 |
| Hopi | 0.0 /100 | #342 | Tragic $36,871 |
| Pueblo | 0.0 /100 | #343 | Tragic $36,859 |
| Arapaho | 0.0 /100 | #344 | Tragic $36,586 |
| Tohono O'odham | 0.0 /100 | #345 | Tragic $36,349 |
| Yup'ik | 0.0 /100 | #346 | Tragic $35,942 |
| Puerto Ricans | 0.0 /100 | #347 | Tragic $35,560 |