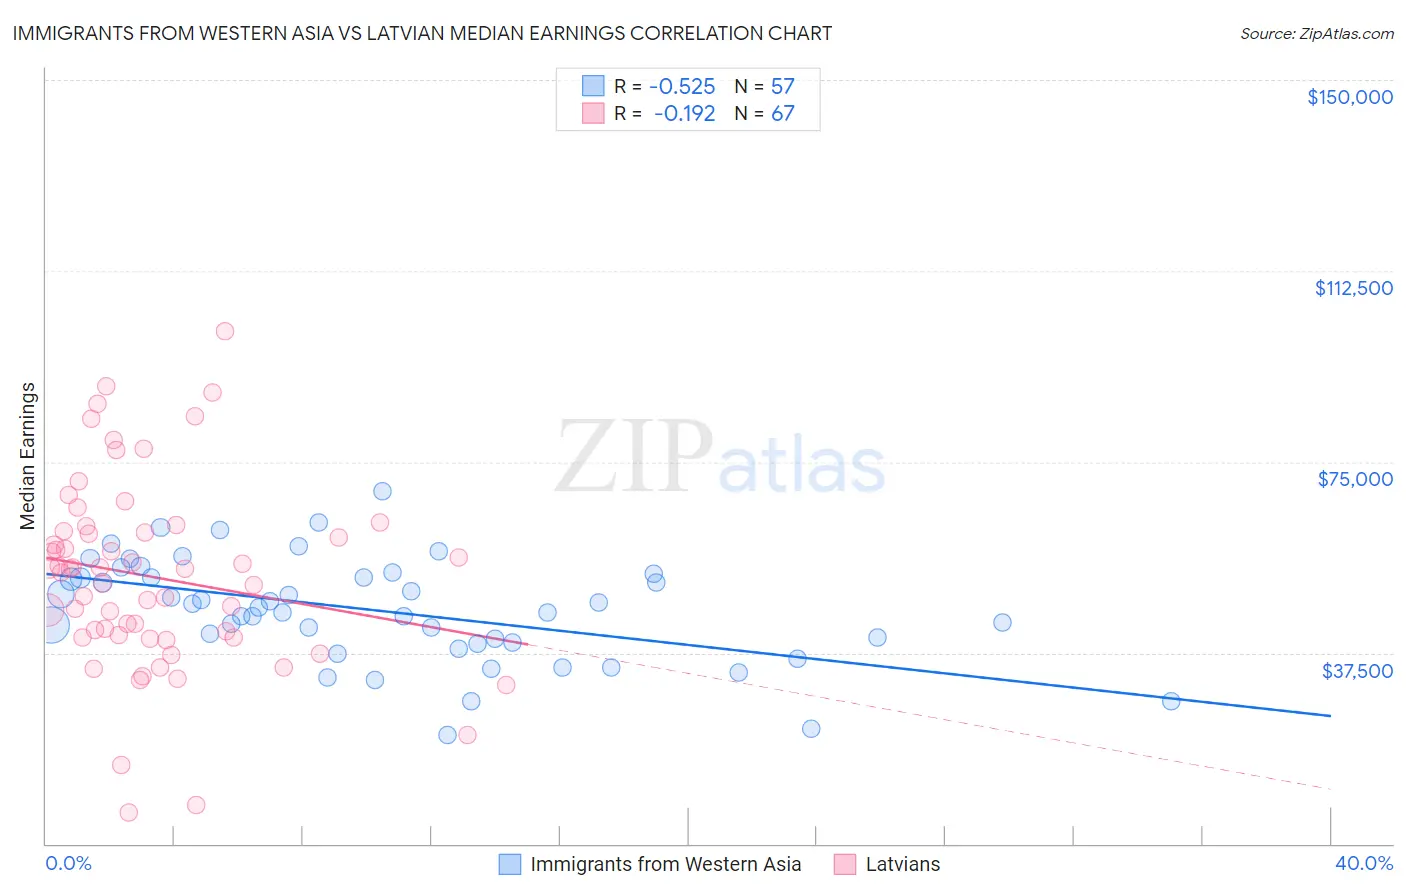
Immigrants from Western Asia vs Latvian Median Earnings
COMPARE
Immigrants from Western Asia
Latvian
Median Earnings
Median Earnings Comparison
Immigrants from Western Asia
Latvians
$49,389
MEDIAN EARNINGS
98.4/ 100
METRIC RATING
105th/ 347
METRIC RANK
$53,001
MEDIAN EARNINGS
100.0/ 100
METRIC RATING
38th/ 347
METRIC RANK
Immigrants from Western Asia vs Latvian Median Earnings Correlation Chart
The statistical analysis conducted on geographies consisting of 404,426,866 people shows a substantial negative correlation between the proportion of Immigrants from Western Asia and median earnings in the United States with a correlation coefficient (R) of -0.525 and weighted average of $49,389. Similarly, the statistical analysis conducted on geographies consisting of 220,722,204 people shows a poor negative correlation between the proportion of Latvians and median earnings in the United States with a correlation coefficient (R) of -0.192 and weighted average of $53,001, a difference of 7.3%.
Median Earnings Correlation Summary
| Measurement | Immigrants from Western Asia | Latvian |
| Minimum | $21,250 | $6,196 |
| Maximum | $69,348 | $100,625 |
| Range | $48,098 | $94,429 |
| Mean | $45,817 | $52,387 |
| Median | $46,307 | $53,984 |
| Interquartile 25% (IQ1) | $39,374 | $40,578 |
| Interquartile 75% (IQ3) | $52,673 | $61,313 |
| Interquartile Range (IQR) | $13,299 | $20,735 |
| Standard Deviation (Sample) | $10,167 | $18,625 |
| Standard Deviation (Population) | $10,077 | $18,485 |
Similar Demographics by Median Earnings
Demographics Similar to Immigrants from Western Asia by Median Earnings
In terms of median earnings, the demographic groups most similar to Immigrants from Western Asia are Immigrants from Albania ($49,377, a difference of 0.020%), Immigrants from Morocco ($49,368, a difference of 0.040%), Immigrants from Brazil ($49,463, a difference of 0.15%), Austrian ($49,501, a difference of 0.23%), and Ethiopian ($49,572, a difference of 0.37%).
| Demographics | Rating | Rank | Median Earnings |
| Immigrants | Northern Africa | 98.9 /100 | #98 | Exceptional $49,648 |
| Immigrants | Afghanistan | 98.9 /100 | #99 | Exceptional $49,645 |
| Immigrants | Poland | 98.9 /100 | #100 | Exceptional $49,633 |
| Jordanians | 98.9 /100 | #101 | Exceptional $49,632 |
| Ethiopians | 98.8 /100 | #102 | Exceptional $49,572 |
| Austrians | 98.7 /100 | #103 | Exceptional $49,501 |
| Immigrants | Brazil | 98.6 /100 | #104 | Exceptional $49,463 |
| Immigrants | Western Asia | 98.4 /100 | #105 | Exceptional $49,389 |
| Immigrants | Albania | 98.4 /100 | #106 | Exceptional $49,377 |
| Immigrants | Morocco | 98.4 /100 | #107 | Exceptional $49,368 |
| Palestinians | 98.0 /100 | #108 | Exceptional $49,209 |
| Syrians | 97.1 /100 | #109 | Exceptional $48,934 |
| Immigrants | Ethiopia | 97.1 /100 | #110 | Exceptional $48,924 |
| Immigrants | Zimbabwe | 97.0 /100 | #111 | Exceptional $48,913 |
| Northern Europeans | 96.9 /100 | #112 | Exceptional $48,887 |
Demographics Similar to Latvians by Median Earnings
In terms of median earnings, the demographic groups most similar to Latvians are Immigrants from Belarus ($53,043, a difference of 0.080%), Immigrants from Turkey ($52,960, a difference of 0.080%), Israeli ($52,937, a difference of 0.12%), Immigrants from Denmark ($53,186, a difference of 0.35%), and Immigrants from Switzerland ($53,211, a difference of 0.40%).
| Demographics | Rating | Rank | Median Earnings |
| Russians | 100.0 /100 | #31 | Exceptional $53,334 |
| Immigrants | Asia | 100.0 /100 | #32 | Exceptional $53,310 |
| Immigrants | Greece | 100.0 /100 | #33 | Exceptional $53,282 |
| Immigrants | Sri Lanka | 100.0 /100 | #34 | Exceptional $53,268 |
| Immigrants | Switzerland | 100.0 /100 | #35 | Exceptional $53,211 |
| Immigrants | Denmark | 100.0 /100 | #36 | Exceptional $53,186 |
| Immigrants | Belarus | 100.0 /100 | #37 | Exceptional $53,043 |
| Latvians | 100.0 /100 | #38 | Exceptional $53,001 |
| Immigrants | Turkey | 100.0 /100 | #39 | Exceptional $52,960 |
| Israelis | 100.0 /100 | #40 | Exceptional $52,937 |
| Immigrants | Lithuania | 100.0 /100 | #41 | Exceptional $52,769 |
| Maltese | 100.0 /100 | #42 | Exceptional $52,526 |
| Immigrants | Malaysia | 100.0 /100 | #43 | Exceptional $52,514 |
| Bulgarians | 100.0 /100 | #44 | Exceptional $52,512 |
| Immigrants | Czechoslovakia | 100.0 /100 | #45 | Exceptional $52,361 |