Immigrants from Western Asia vs Salvadoran Median Earnings
COMPARE
Immigrants from Western Asia
Salvadoran
Median Earnings
Median Earnings Comparison
Immigrants from Western Asia
Salvadorans
$49,389
MEDIAN EARNINGS
98.4/ 100
METRIC RATING
105th/ 347
METRIC RANK
$42,912
MEDIAN EARNINGS
0.7/ 100
METRIC RATING
265th/ 347
METRIC RANK
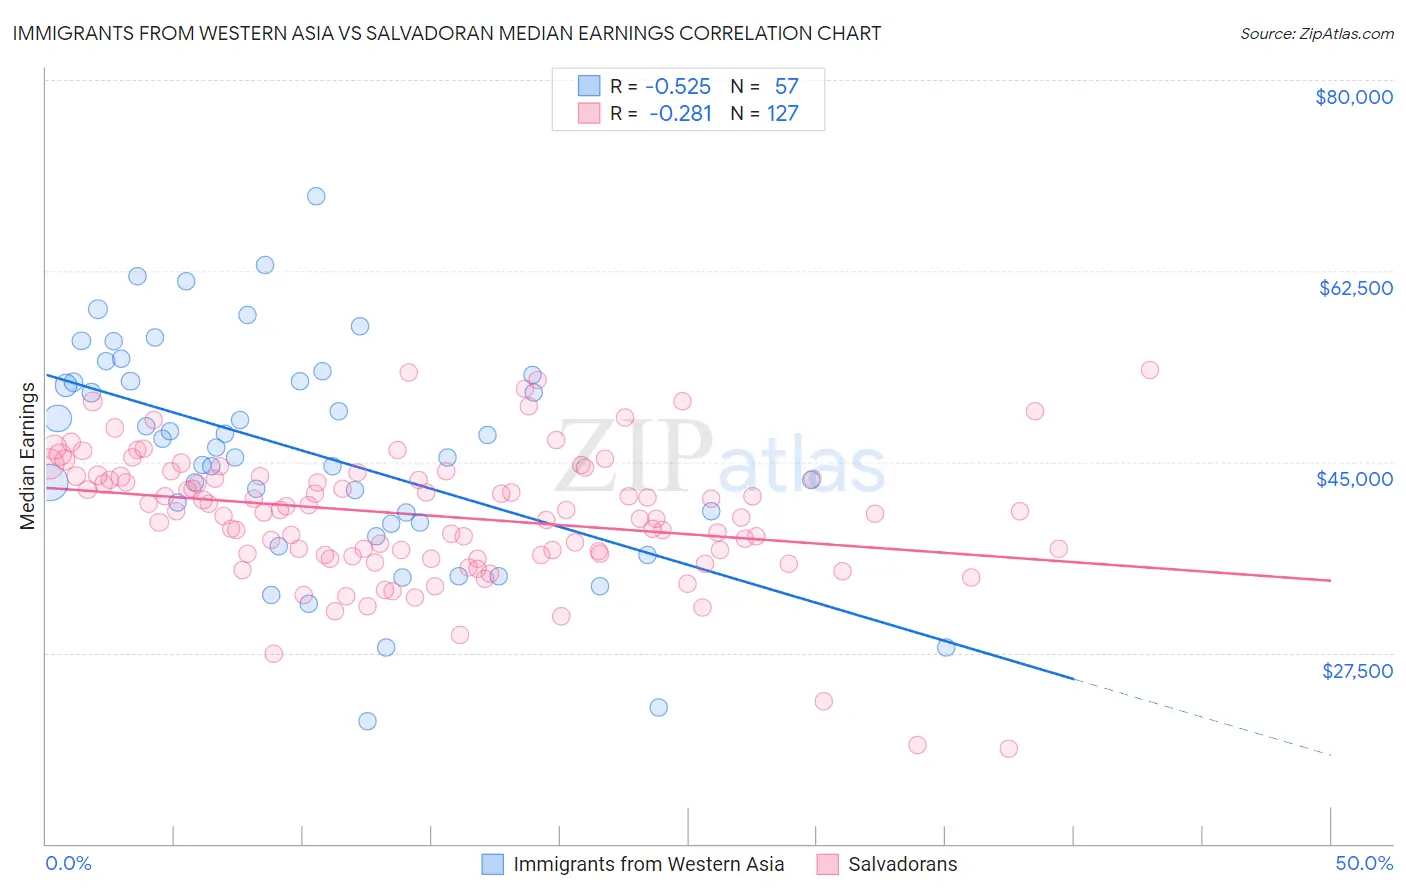
Immigrants from Western Asia vs Salvadoran Median Earnings Correlation Chart
The statistical analysis conducted on geographies consisting of 404,426,866 people shows a substantial negative correlation between the proportion of Immigrants from Western Asia and median earnings in the United States with a correlation coefficient (R) of -0.525 and weighted average of $49,389. Similarly, the statistical analysis conducted on geographies consisting of 398,992,424 people shows a weak negative correlation between the proportion of Salvadorans and median earnings in the United States with a correlation coefficient (R) of -0.281 and weighted average of $42,912, a difference of 15.1%.
Median Earnings Correlation Summary
| Measurement | Immigrants from Western Asia | Salvadoran |
| Minimum | $21,250 | $18,725 |
| Maximum | $69,348 | $53,384 |
| Range | $48,098 | $34,659 |
| Mean | $45,817 | $40,078 |
| Median | $46,307 | $40,477 |
| Interquartile 25% (IQ1) | $39,374 | $36,514 |
| Interquartile 75% (IQ3) | $52,673 | $43,731 |
| Interquartile Range (IQR) | $13,299 | $7,217 |
| Standard Deviation (Sample) | $10,167 | $6,041 |
| Standard Deviation (Population) | $10,077 | $6,017 |
Similar Demographics by Median Earnings
Demographics Similar to Immigrants from Western Asia by Median Earnings
In terms of median earnings, the demographic groups most similar to Immigrants from Western Asia are Immigrants from Albania ($49,377, a difference of 0.020%), Immigrants from Morocco ($49,368, a difference of 0.040%), Immigrants from Brazil ($49,463, a difference of 0.15%), Austrian ($49,501, a difference of 0.23%), and Ethiopian ($49,572, a difference of 0.37%).
| Demographics | Rating | Rank | Median Earnings |
| Immigrants | Northern Africa | 98.9 /100 | #98 | Exceptional $49,648 |
| Immigrants | Afghanistan | 98.9 /100 | #99 | Exceptional $49,645 |
| Immigrants | Poland | 98.9 /100 | #100 | Exceptional $49,633 |
| Jordanians | 98.9 /100 | #101 | Exceptional $49,632 |
| Ethiopians | 98.8 /100 | #102 | Exceptional $49,572 |
| Austrians | 98.7 /100 | #103 | Exceptional $49,501 |
| Immigrants | Brazil | 98.6 /100 | #104 | Exceptional $49,463 |
| Immigrants | Western Asia | 98.4 /100 | #105 | Exceptional $49,389 |
| Immigrants | Albania | 98.4 /100 | #106 | Exceptional $49,377 |
| Immigrants | Morocco | 98.4 /100 | #107 | Exceptional $49,368 |
| Palestinians | 98.0 /100 | #108 | Exceptional $49,209 |
| Syrians | 97.1 /100 | #109 | Exceptional $48,934 |
| Immigrants | Ethiopia | 97.1 /100 | #110 | Exceptional $48,924 |
| Immigrants | Zimbabwe | 97.0 /100 | #111 | Exceptional $48,913 |
| Northern Europeans | 96.9 /100 | #112 | Exceptional $48,887 |
Demographics Similar to Salvadorans by Median Earnings
In terms of median earnings, the demographic groups most similar to Salvadorans are Immigrants from Liberia ($42,923, a difference of 0.030%), Immigrants from Laos ($42,884, a difference of 0.060%), Inupiat ($43,000, a difference of 0.20%), Immigrants from Jamaica ($43,026, a difference of 0.27%), and Nicaraguan ($43,026, a difference of 0.27%).
| Demographics | Rating | Rank | Median Earnings |
| French American Indians | 1.3 /100 | #258 | Tragic $43,333 |
| German Russians | 1.1 /100 | #259 | Tragic $43,200 |
| Immigrants | Somalia | 0.9 /100 | #260 | Tragic $43,100 |
| Immigrants | Jamaica | 0.8 /100 | #261 | Tragic $43,026 |
| Nicaraguans | 0.8 /100 | #262 | Tragic $43,026 |
| Inupiat | 0.8 /100 | #263 | Tragic $43,000 |
| Immigrants | Liberia | 0.7 /100 | #264 | Tragic $42,923 |
| Salvadorans | 0.7 /100 | #265 | Tragic $42,912 |
| Immigrants | Laos | 0.7 /100 | #266 | Tragic $42,884 |
| Cree | 0.6 /100 | #267 | Tragic $42,777 |
| Americans | 0.6 /100 | #268 | Tragic $42,742 |
| Belizeans | 0.5 /100 | #269 | Tragic $42,702 |
| Osage | 0.5 /100 | #270 | Tragic $42,651 |
| Pennsylvania Germans | 0.5 /100 | #271 | Tragic $42,615 |
| Iroquois | 0.4 /100 | #272 | Tragic $42,430 |