Immigrants from Western Asia vs White/Caucasian Median Earnings
COMPARE
Immigrants from Western Asia
White/Caucasian
Median Earnings
Median Earnings Comparison
Immigrants from Western Asia
Whites/Caucasians
$49,389
MEDIAN EARNINGS
98.4/ 100
METRIC RATING
105th/ 347
METRIC RANK
$45,197
MEDIAN EARNINGS
15.0/ 100
METRIC RATING
223rd/ 347
METRIC RANK
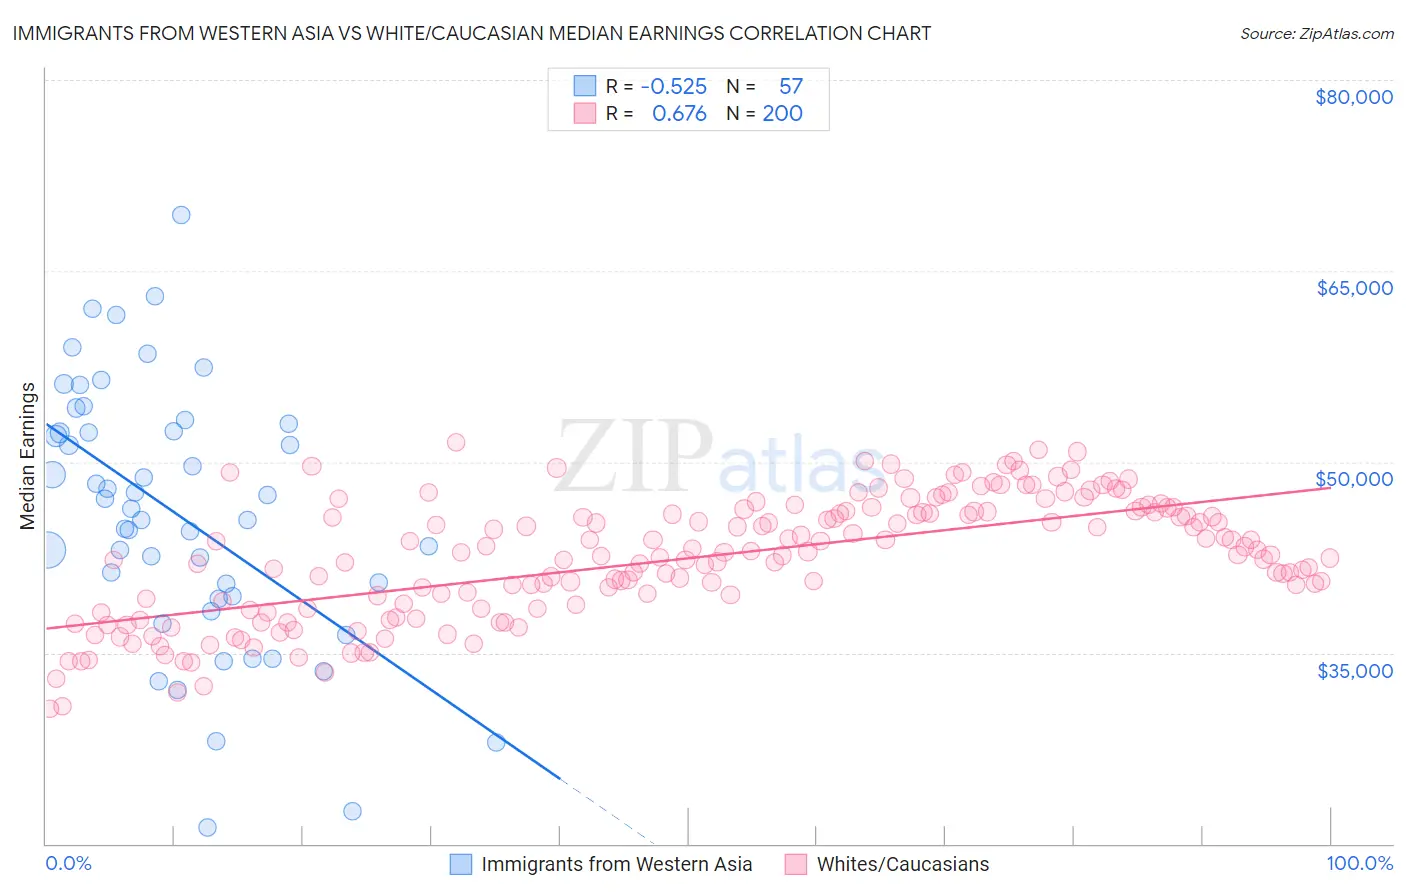
Immigrants from Western Asia vs White/Caucasian Median Earnings Correlation Chart
The statistical analysis conducted on geographies consisting of 404,426,866 people shows a substantial negative correlation between the proportion of Immigrants from Western Asia and median earnings in the United States with a correlation coefficient (R) of -0.525 and weighted average of $49,389. Similarly, the statistical analysis conducted on geographies consisting of 584,189,858 people shows a significant positive correlation between the proportion of Whites/Caucasians and median earnings in the United States with a correlation coefficient (R) of 0.676 and weighted average of $45,197, a difference of 9.3%.
Median Earnings Correlation Summary
| Measurement | Immigrants from Western Asia | White/Caucasian |
| Minimum | $21,250 | $30,625 |
| Maximum | $69,348 | $51,538 |
| Range | $48,098 | $20,913 |
| Mean | $45,817 | $42,432 |
| Median | $46,307 | $42,807 |
| Interquartile 25% (IQ1) | $39,374 | $38,641 |
| Interquartile 75% (IQ3) | $52,673 | $46,089 |
| Interquartile Range (IQR) | $13,299 | $7,448 |
| Standard Deviation (Sample) | $10,167 | $4,733 |
| Standard Deviation (Population) | $10,077 | $4,721 |
Similar Demographics by Median Earnings
Demographics Similar to Immigrants from Western Asia by Median Earnings
In terms of median earnings, the demographic groups most similar to Immigrants from Western Asia are Immigrants from Albania ($49,377, a difference of 0.020%), Immigrants from Morocco ($49,368, a difference of 0.040%), Immigrants from Brazil ($49,463, a difference of 0.15%), Austrian ($49,501, a difference of 0.23%), and Ethiopian ($49,572, a difference of 0.37%).
| Demographics | Rating | Rank | Median Earnings |
| Immigrants | Northern Africa | 98.9 /100 | #98 | Exceptional $49,648 |
| Immigrants | Afghanistan | 98.9 /100 | #99 | Exceptional $49,645 |
| Immigrants | Poland | 98.9 /100 | #100 | Exceptional $49,633 |
| Jordanians | 98.9 /100 | #101 | Exceptional $49,632 |
| Ethiopians | 98.8 /100 | #102 | Exceptional $49,572 |
| Austrians | 98.7 /100 | #103 | Exceptional $49,501 |
| Immigrants | Brazil | 98.6 /100 | #104 | Exceptional $49,463 |
| Immigrants | Western Asia | 98.4 /100 | #105 | Exceptional $49,389 |
| Immigrants | Albania | 98.4 /100 | #106 | Exceptional $49,377 |
| Immigrants | Morocco | 98.4 /100 | #107 | Exceptional $49,368 |
| Palestinians | 98.0 /100 | #108 | Exceptional $49,209 |
| Syrians | 97.1 /100 | #109 | Exceptional $48,934 |
| Immigrants | Ethiopia | 97.1 /100 | #110 | Exceptional $48,924 |
| Immigrants | Zimbabwe | 97.0 /100 | #111 | Exceptional $48,913 |
| Northern Europeans | 96.9 /100 | #112 | Exceptional $48,887 |
Demographics Similar to Whites/Caucasians by Median Earnings
In terms of median earnings, the demographic groups most similar to Whites/Caucasians are Immigrants from Panama ($45,198, a difference of 0.0%), Immigrants from Guyana ($45,204, a difference of 0.020%), Ecuadorian ($45,214, a difference of 0.040%), West Indian ($45,132, a difference of 0.15%), and Immigrants from Cambodia ($45,090, a difference of 0.24%).
| Demographics | Rating | Rank | Median Earnings |
| Guyanese | 20.6 /100 | #216 | Fair $45,470 |
| Tlingit-Haida | 20.5 /100 | #217 | Fair $45,468 |
| Spanish | 19.7 /100 | #218 | Poor $45,432 |
| Dutch | 18.4 /100 | #219 | Poor $45,370 |
| Ecuadorians | 15.3 /100 | #220 | Poor $45,214 |
| Immigrants | Guyana | 15.1 /100 | #221 | Poor $45,204 |
| Immigrants | Panama | 15.0 /100 | #222 | Poor $45,198 |
| Whites/Caucasians | 15.0 /100 | #223 | Poor $45,197 |
| West Indians | 13.9 /100 | #224 | Poor $45,132 |
| Immigrants | Cambodia | 13.2 /100 | #225 | Poor $45,090 |
| Immigrants | Nigeria | 12.2 /100 | #226 | Poor $45,030 |
| Native Hawaiians | 12.2 /100 | #227 | Poor $45,027 |
| Immigrants | Iraq | 11.6 /100 | #228 | Poor $44,988 |
| Scotch-Irish | 10.7 /100 | #229 | Poor $44,924 |
| Immigrants | Western Africa | 10.3 /100 | #230 | Poor $44,893 |