Immigrants from Sierra Leone vs Aleut Wage/Income Gap
COMPARE
Immigrants from Sierra Leone
Aleut
Wage/Income Gap
Wage/Income Gap Comparison
Immigrants from Sierra Leone
Aleuts
21.4%
WAGE/INCOME GAP
100.0/ 100
METRIC RATING
42nd/ 347
METRIC RANK
23.7%
WAGE/INCOME GAP
99.2/ 100
METRIC RATING
99th/ 347
METRIC RANK
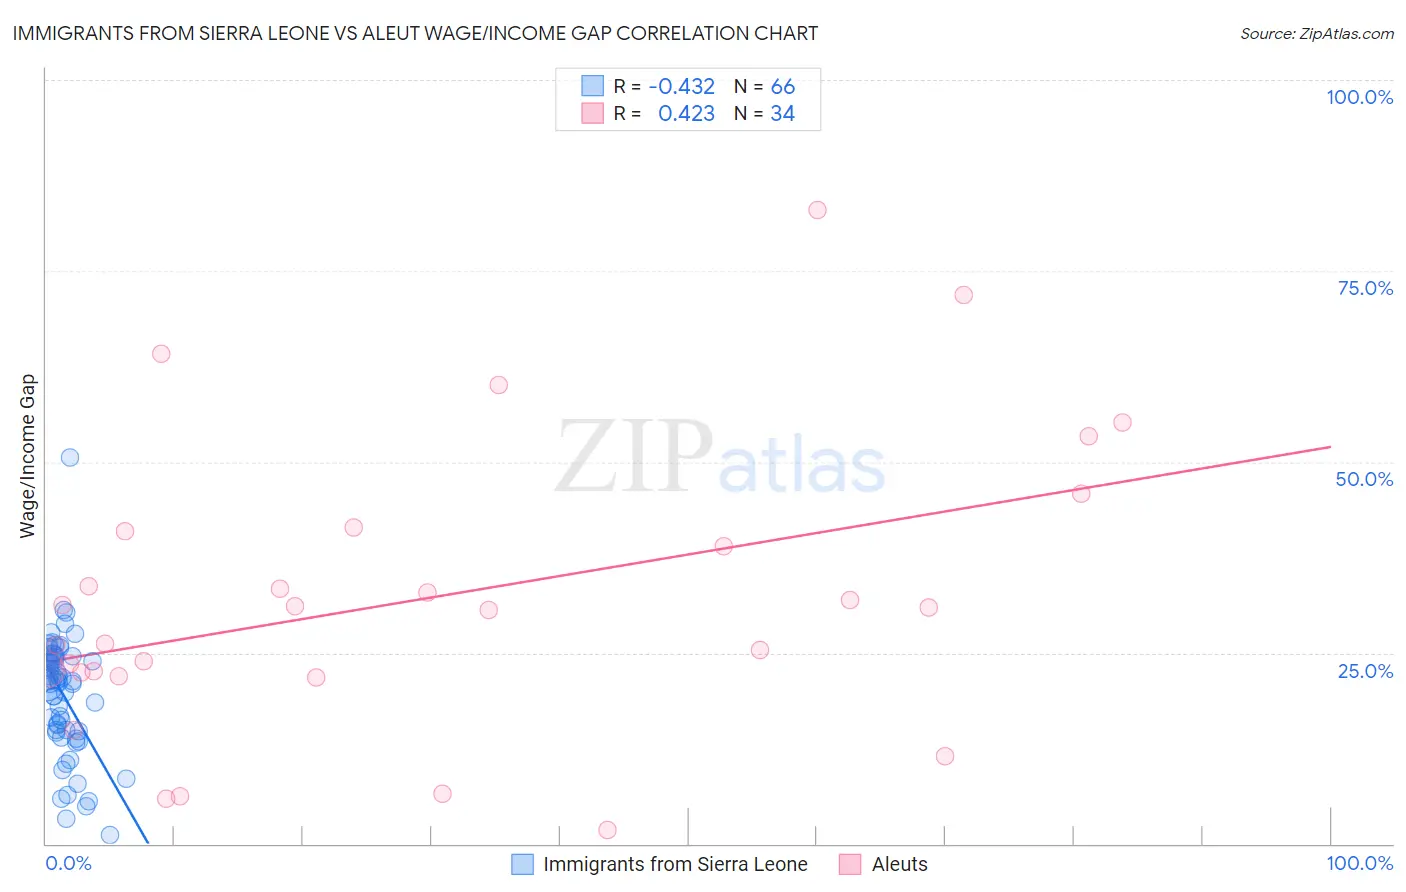
Immigrants from Sierra Leone vs Aleut Wage/Income Gap Correlation Chart
The statistical analysis conducted on geographies consisting of 101,633,486 people shows a moderate negative correlation between the proportion of Immigrants from Sierra Leone and wage/income gap percentage in the United States with a correlation coefficient (R) of -0.432 and weighted average of 21.4%. Similarly, the statistical analysis conducted on geographies consisting of 61,745,679 people shows a moderate positive correlation between the proportion of Aleuts and wage/income gap percentage in the United States with a correlation coefficient (R) of 0.423 and weighted average of 23.7%, a difference of 10.8%.
Wage/Income Gap Correlation Summary
| Measurement | Immigrants from Sierra Leone | Aleut |
| Minimum | 1.1% | 1.9% |
| Maximum | 50.6% | 83.0% |
| Range | 49.5% | 81.1% |
| Mean | 19.5% | 32.2% |
| Median | 21.2% | 30.8% |
| Interquartile 25% (IQ1) | 14.7% | 22.4% |
| Interquartile 75% (IQ3) | 24.6% | 41.0% |
| Interquartile Range (IQR) | 9.9% | 18.6% |
| Standard Deviation (Sample) | 8.0% | 18.9% |
| Standard Deviation (Population) | 8.0% | 18.6% |
Similar Demographics by Wage/Income Gap
Demographics Similar to Immigrants from Sierra Leone by Wage/Income Gap
In terms of wage/income gap, the demographic groups most similar to Immigrants from Sierra Leone are Liberian (21.4%, a difference of 0.0%), Sierra Leonean (21.4%, a difference of 0.060%), Immigrants from Eritrea (21.4%, a difference of 0.080%), Lumbee (21.3%, a difference of 0.49%), and U.S. Virgin Islander (21.5%, a difference of 0.52%).
| Demographics | Rating | Rank | Wage/Income Gap |
| Somalis | 100.0 /100 | #35 | Exceptional 21.2% |
| Belizeans | 100.0 /100 | #36 | Exceptional 21.2% |
| Immigrants | Somalia | 100.0 /100 | #37 | Exceptional 21.2% |
| Immigrants | Belize | 100.0 /100 | #38 | Exceptional 21.3% |
| Colville | 100.0 /100 | #39 | Exceptional 21.3% |
| Lumbee | 100.0 /100 | #40 | Exceptional 21.3% |
| Liberians | 100.0 /100 | #41 | Exceptional 21.4% |
| Immigrants | Sierra Leone | 100.0 /100 | #42 | Exceptional 21.4% |
| Sierra Leoneans | 100.0 /100 | #43 | Exceptional 21.4% |
| Immigrants | Eritrea | 100.0 /100 | #44 | Exceptional 21.4% |
| U.S. Virgin Islanders | 100.0 /100 | #45 | Exceptional 21.5% |
| Immigrants | Ethiopia | 100.0 /100 | #46 | Exceptional 21.6% |
| Immigrants | Congo | 100.0 /100 | #47 | Exceptional 21.7% |
| Blacks/African Americans | 100.0 /100 | #48 | Exceptional 21.7% |
| Ethiopians | 100.0 /100 | #49 | Exceptional 21.8% |
Demographics Similar to Aleuts by Wage/Income Gap
In terms of wage/income gap, the demographic groups most similar to Aleuts are Yakama (23.7%, a difference of 0.020%), Immigrants from Latin America (23.7%, a difference of 0.070%), Japanese (23.8%, a difference of 0.17%), Immigrants from Laos (23.8%, a difference of 0.32%), and Immigrants from Sudan (23.6%, a difference of 0.47%).
| Demographics | Rating | Rank | Wage/Income Gap |
| Immigrants | Honduras | 99.5 /100 | #92 | Exceptional 23.5% |
| Immigrants | Cabo Verde | 99.5 /100 | #93 | Exceptional 23.6% |
| Hondurans | 99.5 /100 | #94 | Exceptional 23.6% |
| Cape Verdeans | 99.4 /100 | #95 | Exceptional 23.6% |
| Kiowa | 99.4 /100 | #96 | Exceptional 23.6% |
| Immigrants | Sudan | 99.4 /100 | #97 | Exceptional 23.6% |
| Immigrants | Latin America | 99.2 /100 | #98 | Exceptional 23.7% |
| Aleuts | 99.2 /100 | #99 | Exceptional 23.7% |
| Yakama | 99.2 /100 | #100 | Exceptional 23.7% |
| Japanese | 99.1 /100 | #101 | Exceptional 23.8% |
| Immigrants | Laos | 99.0 /100 | #102 | Exceptional 23.8% |
| Tsimshian | 98.9 /100 | #103 | Exceptional 23.9% |
| Tlingit-Haida | 98.7 /100 | #104 | Exceptional 24.0% |
| Moroccans | 98.6 /100 | #105 | Exceptional 24.0% |
| Sudanese | 98.6 /100 | #106 | Exceptional 24.0% |