Brazilian vs Aleut Wage/Income Gap
COMPARE
Brazilian
Aleut
Wage/Income Gap
Wage/Income Gap Comparison
Brazilians
Aleuts
26.7%
WAGE/INCOME GAP
9.2/ 100
METRIC RATING
217th/ 347
METRIC RANK
23.7%
WAGE/INCOME GAP
99.2/ 100
METRIC RATING
99th/ 347
METRIC RANK
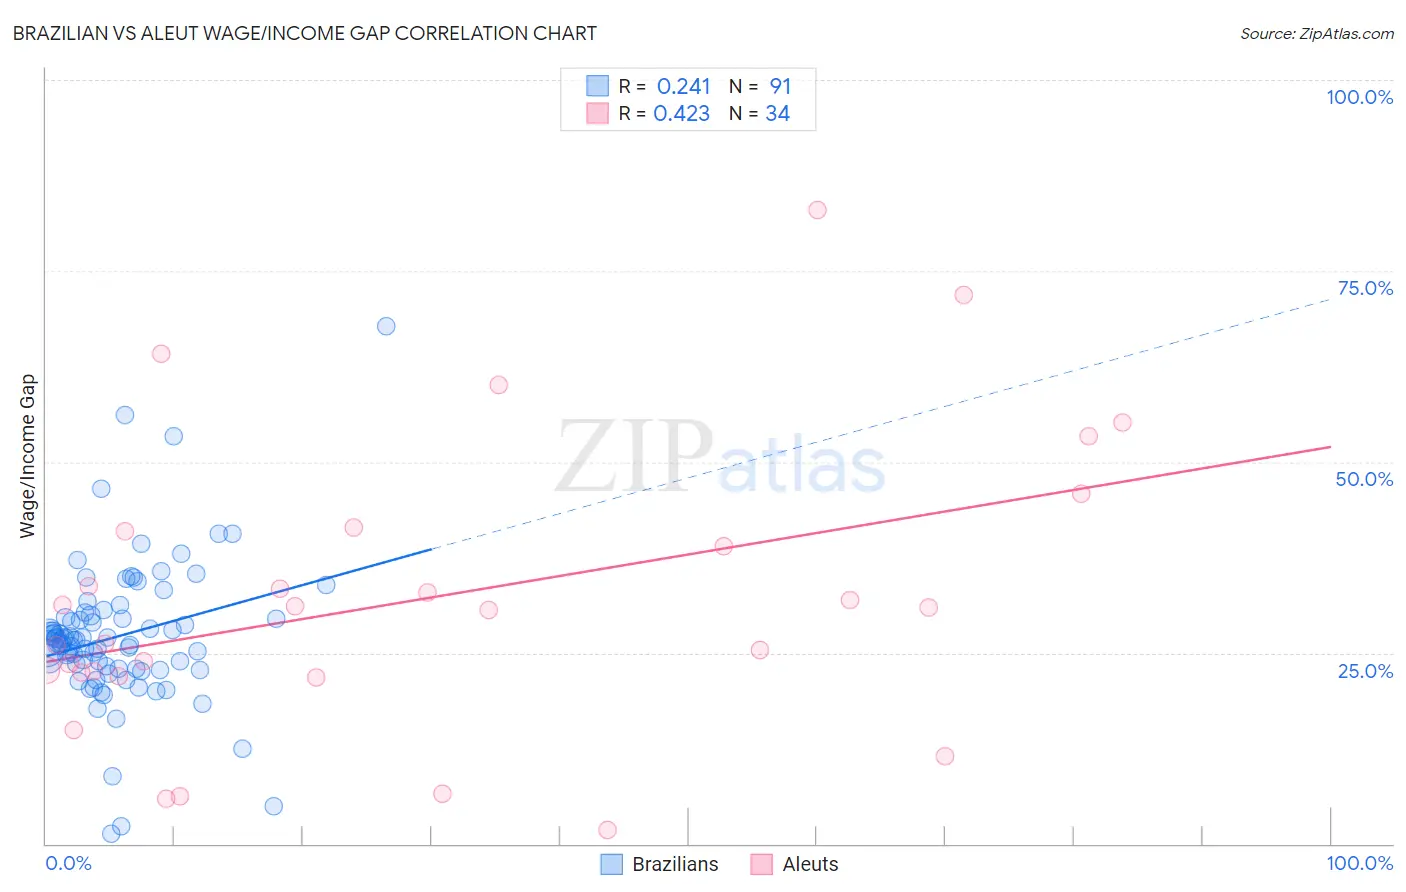
Brazilian vs Aleut Wage/Income Gap Correlation Chart
The statistical analysis conducted on geographies consisting of 323,810,201 people shows a weak positive correlation between the proportion of Brazilians and wage/income gap percentage in the United States with a correlation coefficient (R) of 0.241 and weighted average of 26.7%. Similarly, the statistical analysis conducted on geographies consisting of 61,745,679 people shows a moderate positive correlation between the proportion of Aleuts and wage/income gap percentage in the United States with a correlation coefficient (R) of 0.423 and weighted average of 23.7%, a difference of 12.6%.
Wage/Income Gap Correlation Summary
| Measurement | Brazilian | Aleut |
| Minimum | 1.4% | 1.9% |
| Maximum | 67.8% | 83.0% |
| Range | 66.4% | 81.1% |
| Mean | 27.2% | 32.2% |
| Median | 26.7% | 30.8% |
| Interquartile 25% (IQ1) | 22.9% | 22.4% |
| Interquartile 75% (IQ3) | 29.9% | 41.0% |
| Interquartile Range (IQR) | 7.0% | 18.6% |
| Standard Deviation (Sample) | 9.5% | 18.9% |
| Standard Deviation (Population) | 9.5% | 18.6% |
Similar Demographics by Wage/Income Gap
Demographics Similar to Brazilians by Wage/Income Gap
In terms of wage/income gap, the demographic groups most similar to Brazilians are Immigrants from Saudi Arabia (26.7%, a difference of 0.030%), Immigrants from Portugal (26.7%, a difference of 0.050%), Immigrants from Poland (26.7%, a difference of 0.050%), Immigrants from Latvia (26.7%, a difference of 0.070%), and Yugoslavian (26.7%, a difference of 0.10%).
| Demographics | Rating | Rank | Wage/Income Gap |
| Arabs | 12.3 /100 | #210 | Poor 26.6% |
| Mongolians | 11.4 /100 | #211 | Poor 26.6% |
| Iraqis | 11.2 /100 | #212 | Poor 26.6% |
| Immigrants | Iraq | 10.3 /100 | #213 | Poor 26.7% |
| Immigrants | China | 10.3 /100 | #214 | Poor 26.7% |
| Yugoslavians | 9.7 /100 | #215 | Tragic 26.7% |
| Immigrants | Portugal | 9.5 /100 | #216 | Tragic 26.7% |
| Brazilians | 9.2 /100 | #217 | Tragic 26.7% |
| Immigrants | Saudi Arabia | 9.1 /100 | #218 | Tragic 26.7% |
| Immigrants | Poland | 8.9 /100 | #219 | Tragic 26.7% |
| Immigrants | Latvia | 8.9 /100 | #220 | Tragic 26.7% |
| Immigrants | Spain | 8.5 /100 | #221 | Tragic 26.8% |
| Bolivians | 8.3 /100 | #222 | Tragic 26.8% |
| Jordanians | 8.0 /100 | #223 | Tragic 26.8% |
| Immigrants | Argentina | 7.2 /100 | #224 | Tragic 26.8% |
Demographics Similar to Aleuts by Wage/Income Gap
In terms of wage/income gap, the demographic groups most similar to Aleuts are Yakama (23.7%, a difference of 0.020%), Immigrants from Latin America (23.7%, a difference of 0.070%), Japanese (23.8%, a difference of 0.17%), Immigrants from Laos (23.8%, a difference of 0.32%), and Immigrants from Sudan (23.6%, a difference of 0.47%).
| Demographics | Rating | Rank | Wage/Income Gap |
| Immigrants | Honduras | 99.5 /100 | #92 | Exceptional 23.5% |
| Immigrants | Cabo Verde | 99.5 /100 | #93 | Exceptional 23.6% |
| Hondurans | 99.5 /100 | #94 | Exceptional 23.6% |
| Cape Verdeans | 99.4 /100 | #95 | Exceptional 23.6% |
| Kiowa | 99.4 /100 | #96 | Exceptional 23.6% |
| Immigrants | Sudan | 99.4 /100 | #97 | Exceptional 23.6% |
| Immigrants | Latin America | 99.2 /100 | #98 | Exceptional 23.7% |
| Aleuts | 99.2 /100 | #99 | Exceptional 23.7% |
| Yakama | 99.2 /100 | #100 | Exceptional 23.7% |
| Japanese | 99.1 /100 | #101 | Exceptional 23.8% |
| Immigrants | Laos | 99.0 /100 | #102 | Exceptional 23.8% |
| Tsimshian | 98.9 /100 | #103 | Exceptional 23.9% |
| Tlingit-Haida | 98.7 /100 | #104 | Exceptional 24.0% |
| Moroccans | 98.6 /100 | #105 | Exceptional 24.0% |
| Sudanese | 98.6 /100 | #106 | Exceptional 24.0% |