Immigrants from Romania vs Cambodian Master's Degree
COMPARE
Immigrants from Romania
Cambodian
Master's Degree
Master's Degree Comparison
Immigrants from Romania
Cambodians
17.7%
MASTER'S DEGREE
99.7/ 100
METRIC RATING
74th/ 347
METRIC RANK
20.0%
MASTER'S DEGREE
100.0/ 100
METRIC RATING
26th/ 347
METRIC RANK
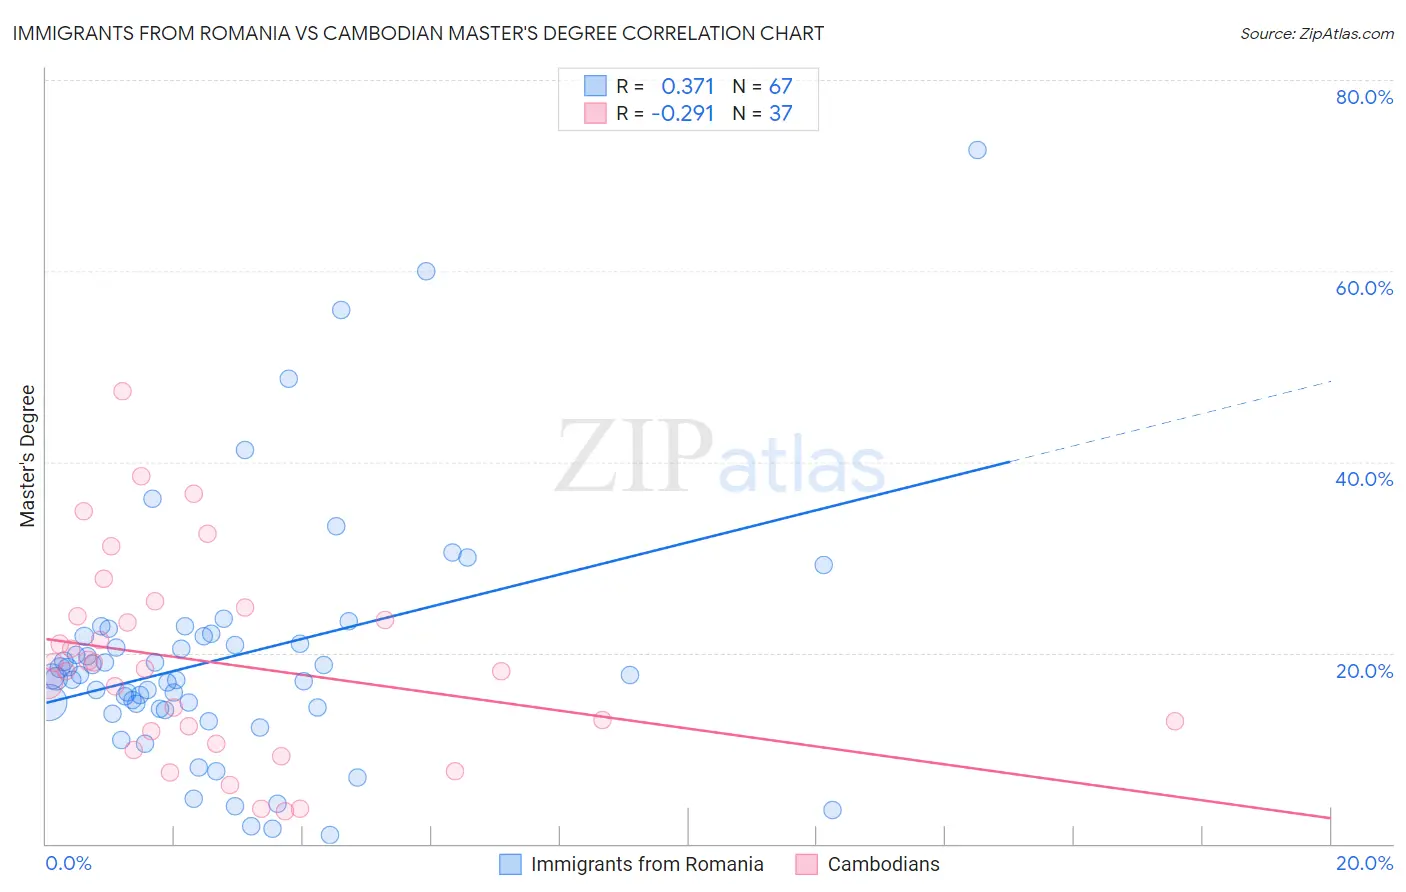
Immigrants from Romania vs Cambodian Master's Degree Correlation Chart
The statistical analysis conducted on geographies consisting of 256,994,499 people shows a mild positive correlation between the proportion of Immigrants from Romania and percentage of population with at least master's degree education in the United States with a correlation coefficient (R) of 0.371 and weighted average of 17.7%. Similarly, the statistical analysis conducted on geographies consisting of 102,506,989 people shows a weak negative correlation between the proportion of Cambodians and percentage of population with at least master's degree education in the United States with a correlation coefficient (R) of -0.291 and weighted average of 20.0%, a difference of 13.2%.
Master's Degree Correlation Summary
| Measurement | Immigrants from Romania | Cambodian |
| Minimum | 0.91% | 3.4% |
| Maximum | 72.6% | 47.4% |
| Range | 71.7% | 44.1% |
| Mean | 19.6% | 19.0% |
| Median | 17.5% | 18.3% |
| Interquartile 25% (IQ1) | 14.1% | 11.2% |
| Interquartile 75% (IQ3) | 21.8% | 24.3% |
| Interquartile Range (IQR) | 7.7% | 13.2% |
| Standard Deviation (Sample) | 12.9% | 10.4% |
| Standard Deviation (Population) | 12.8% | 10.3% |
Similar Demographics by Master's Degree
Demographics Similar to Immigrants from Romania by Master's Degree
In terms of master's degree, the demographic groups most similar to Immigrants from Romania are Zimbabwean (17.7%, a difference of 0.31%), Egyptian (17.6%, a difference of 0.38%), Immigrants from Indonesia (17.6%, a difference of 0.40%), Lithuanian (17.7%, a difference of 0.41%), and Immigrants from Eastern Europe (17.6%, a difference of 0.52%).
| Demographics | Rating | Rank | Master's Degree |
| Immigrants | Argentina | 99.8 /100 | #67 | Exceptional 18.0% |
| Immigrants | Ethiopia | 99.8 /100 | #68 | Exceptional 17.9% |
| Immigrants | Uzbekistan | 99.8 /100 | #69 | Exceptional 17.9% |
| Immigrants | Western Europe | 99.8 /100 | #70 | Exceptional 17.8% |
| Immigrants | Pakistan | 99.7 /100 | #71 | Exceptional 17.8% |
| Lithuanians | 99.7 /100 | #72 | Exceptional 17.7% |
| Zimbabweans | 99.7 /100 | #73 | Exceptional 17.7% |
| Immigrants | Romania | 99.7 /100 | #74 | Exceptional 17.7% |
| Egyptians | 99.6 /100 | #75 | Exceptional 17.6% |
| Immigrants | Indonesia | 99.6 /100 | #76 | Exceptional 17.6% |
| Immigrants | Eastern Europe | 99.6 /100 | #77 | Exceptional 17.6% |
| Immigrants | Hungary | 99.6 /100 | #78 | Exceptional 17.5% |
| Immigrants | Lebanon | 99.6 /100 | #79 | Exceptional 17.5% |
| Carpatho Rusyns | 99.6 /100 | #80 | Exceptional 17.5% |
| Immigrants | Western Asia | 99.5 /100 | #81 | Exceptional 17.5% |
Demographics Similar to Cambodians by Master's Degree
In terms of master's degree, the demographic groups most similar to Cambodians are Immigrants from Japan (20.0%, a difference of 0.10%), Immigrants from Sri Lanka (19.9%, a difference of 0.41%), Turkish (19.9%, a difference of 0.48%), Latvian (19.8%, a difference of 0.89%), and Immigrants from Sweden (20.3%, a difference of 1.4%).
| Demographics | Rating | Rank | Master's Degree |
| Immigrants | Hong Kong | 100.0 /100 | #19 | Exceptional 20.5% |
| Indians (Asian) | 100.0 /100 | #20 | Exceptional 20.5% |
| Immigrants | Ireland | 100.0 /100 | #21 | Exceptional 20.4% |
| Israelis | 100.0 /100 | #22 | Exceptional 20.3% |
| Immigrants | France | 100.0 /100 | #23 | Exceptional 20.3% |
| Immigrants | Sweden | 100.0 /100 | #24 | Exceptional 20.3% |
| Immigrants | Japan | 100.0 /100 | #25 | Exceptional 20.0% |
| Cambodians | 100.0 /100 | #26 | Exceptional 20.0% |
| Immigrants | Sri Lanka | 100.0 /100 | #27 | Exceptional 19.9% |
| Turks | 100.0 /100 | #28 | Exceptional 19.9% |
| Latvians | 100.0 /100 | #29 | Exceptional 19.8% |
| Immigrants | Turkey | 100.0 /100 | #30 | Exceptional 19.7% |
| Immigrants | Korea | 100.0 /100 | #31 | Exceptional 19.7% |
| Burmese | 100.0 /100 | #32 | Exceptional 19.7% |
| Russians | 100.0 /100 | #33 | Exceptional 19.5% |