Immigrants from Romania vs Cambodian Unemployment Among Ages 16 to 19 years
COMPARE
Immigrants from Romania
Cambodian
Unemployment Among Ages 16 to 19 years
Unemployment Among Ages 16 to 19 years Comparison
Immigrants from Romania
Cambodians
17.5%
UNEMPLOYMENT AMONG AGES 16 TO 19 YEARS
53.3/ 100
METRIC RATING
170th/ 347
METRIC RANK
16.9%
UNEMPLOYMENT AMONG AGES 16 TO 19 YEARS
96.3/ 100
METRIC RATING
91st/ 347
METRIC RANK
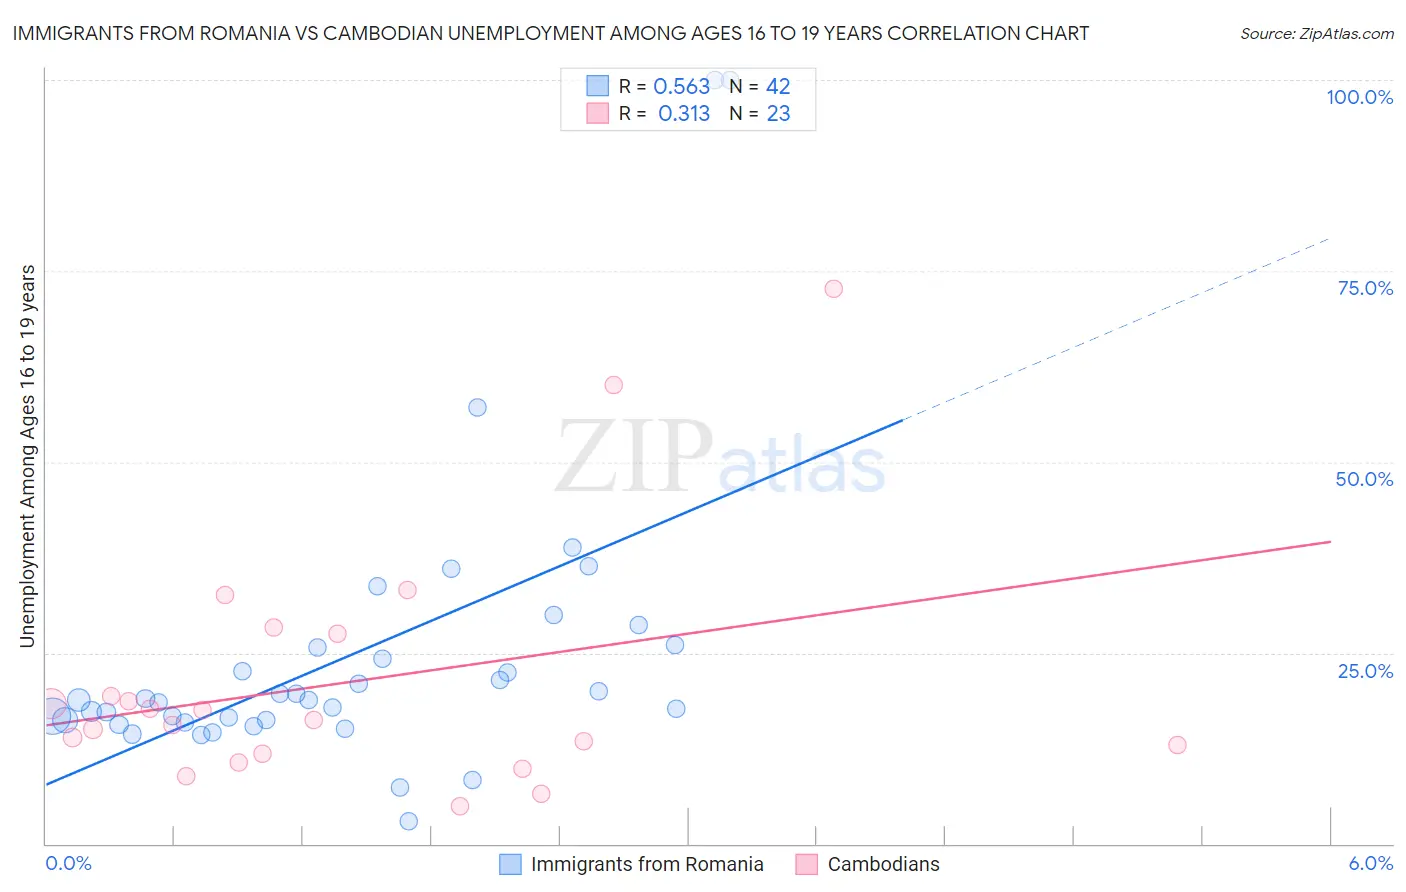
Immigrants from Romania vs Cambodian Unemployment Among Ages 16 to 19 years Correlation Chart
The statistical analysis conducted on geographies consisting of 248,059,296 people shows a substantial positive correlation between the proportion of Immigrants from Romania and unemployment rate among population between the ages 16 and 19 in the United States with a correlation coefficient (R) of 0.563 and weighted average of 17.5%. Similarly, the statistical analysis conducted on geographies consisting of 100,775,991 people shows a mild positive correlation between the proportion of Cambodians and unemployment rate among population between the ages 16 and 19 in the United States with a correlation coefficient (R) of 0.313 and weighted average of 16.9%, a difference of 3.9%.
Unemployment Among Ages 16 to 19 years Correlation Summary
| Measurement | Immigrants from Romania | Cambodian |
| Minimum | 3.0% | 4.9% |
| Maximum | 100.0% | 72.7% |
| Range | 97.0% | 67.8% |
| Mean | 24.6% | 21.1% |
| Median | 18.8% | 16.2% |
| Interquartile 25% (IQ1) | 16.1% | 11.8% |
| Interquartile 75% (IQ3) | 25.6% | 27.4% |
| Interquartile Range (IQR) | 9.5% | 15.6% |
| Standard Deviation (Sample) | 19.4% | 16.3% |
| Standard Deviation (Population) | 19.2% | 15.9% |
Similar Demographics by Unemployment Among Ages 16 to 19 years
Demographics Similar to Immigrants from Romania by Unemployment Among Ages 16 to 19 years
In terms of unemployment among ages 16 to 19 years, the demographic groups most similar to Immigrants from Romania are Immigrants from Switzerland (17.5%, a difference of 0.0%), Immigrants from Western Europe (17.6%, a difference of 0.050%), Immigrants from Cambodia (17.5%, a difference of 0.060%), Immigrants from Hungary (17.5%, a difference of 0.070%), and Immigrants from France (17.5%, a difference of 0.080%).
| Demographics | Rating | Rank | Unemployment Among Ages 16 to 19 years |
| Egyptians | 59.7 /100 | #163 | Average 17.5% |
| Immigrants | Austria | 57.7 /100 | #164 | Average 17.5% |
| Cape Verdeans | 55.8 /100 | #165 | Average 17.5% |
| Immigrants | Italy | 55.2 /100 | #166 | Average 17.5% |
| Immigrants | France | 54.9 /100 | #167 | Average 17.5% |
| Immigrants | Hungary | 54.7 /100 | #168 | Average 17.5% |
| Immigrants | Cambodia | 54.5 /100 | #169 | Average 17.5% |
| Immigrants | Romania | 53.3 /100 | #170 | Average 17.5% |
| Immigrants | Switzerland | 53.2 /100 | #171 | Average 17.5% |
| Immigrants | Western Europe | 52.2 /100 | #172 | Average 17.6% |
| Chileans | 50.8 /100 | #173 | Average 17.6% |
| Osage | 50.0 /100 | #174 | Average 17.6% |
| Immigrants | Sweden | 49.1 /100 | #175 | Average 17.6% |
| Nicaraguans | 48.9 /100 | #176 | Average 17.6% |
| Bermudans | 48.7 /100 | #177 | Average 17.6% |
Demographics Similar to Cambodians by Unemployment Among Ages 16 to 19 years
In terms of unemployment among ages 16 to 19 years, the demographic groups most similar to Cambodians are Asian (16.9%, a difference of 0.080%), Canadian (16.9%, a difference of 0.12%), South African (16.9%, a difference of 0.13%), Cuban (16.9%, a difference of 0.17%), and Bangladeshi (16.9%, a difference of 0.19%).
| Demographics | Rating | Rank | Unemployment Among Ages 16 to 19 years |
| French | 97.4 /100 | #84 | Exceptional 16.8% |
| Immigrants | Kuwait | 97.2 /100 | #85 | Exceptional 16.8% |
| Immigrants | Scotland | 97.2 /100 | #86 | Exceptional 16.8% |
| Greeks | 97.0 /100 | #87 | Exceptional 16.9% |
| Immigrants | South Africa | 96.9 /100 | #88 | Exceptional 16.9% |
| Canadians | 96.7 /100 | #89 | Exceptional 16.9% |
| Asians | 96.6 /100 | #90 | Exceptional 16.9% |
| Cambodians | 96.3 /100 | #91 | Exceptional 16.9% |
| South Africans | 95.9 /100 | #92 | Exceptional 16.9% |
| Cubans | 95.8 /100 | #93 | Exceptional 16.9% |
| Bangladeshis | 95.8 /100 | #94 | Exceptional 16.9% |
| Mongolians | 95.6 /100 | #95 | Exceptional 16.9% |
| Ottawa | 95.4 /100 | #96 | Exceptional 16.9% |
| Immigrants | Venezuela | 95.3 /100 | #97 | Exceptional 16.9% |
| Burmese | 95.0 /100 | #98 | Exceptional 17.0% |