Immigrants from Netherlands vs Japanese Wage/Income Gap
COMPARE
Immigrants from Netherlands
Japanese
Wage/Income Gap
Wage/Income Gap Comparison
Immigrants from Netherlands
Japanese
28.5%
WAGE/INCOME GAP
0.2/ 100
METRIC RATING
304th/ 347
METRIC RANK
23.8%
WAGE/INCOME GAP
99.1/ 100
METRIC RATING
101st/ 347
METRIC RANK
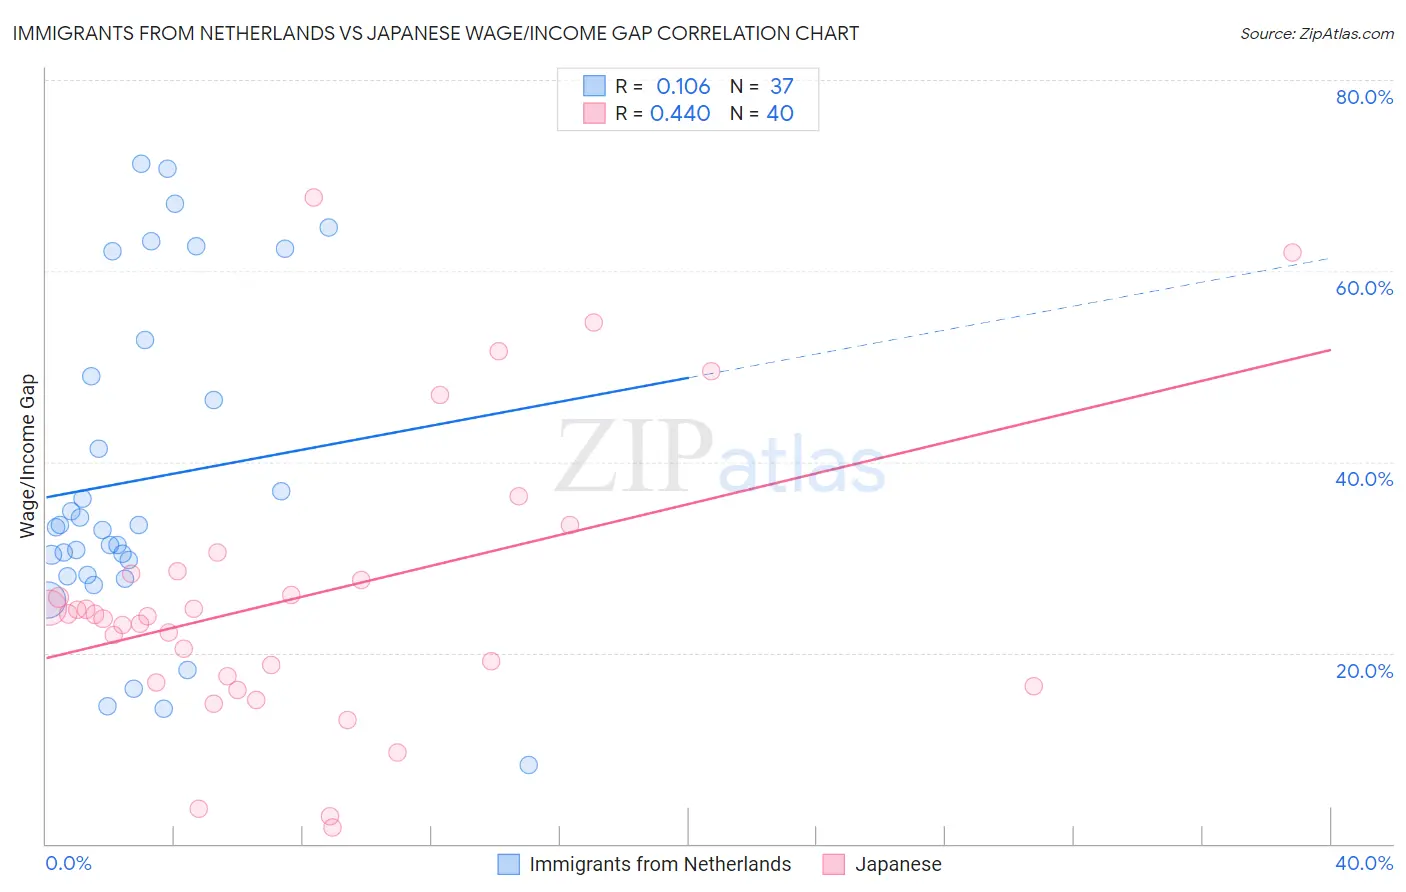
Immigrants from Netherlands vs Japanese Wage/Income Gap Correlation Chart
The statistical analysis conducted on geographies consisting of 237,766,220 people shows a poor positive correlation between the proportion of Immigrants from Netherlands and wage/income gap percentage in the United States with a correlation coefficient (R) of 0.106 and weighted average of 28.5%. Similarly, the statistical analysis conducted on geographies consisting of 249,130,971 people shows a moderate positive correlation between the proportion of Japanese and wage/income gap percentage in the United States with a correlation coefficient (R) of 0.440 and weighted average of 23.8%, a difference of 19.8%.
Wage/Income Gap Correlation Summary
| Measurement | Immigrants from Netherlands | Japanese |
| Minimum | 8.2% | 1.7% |
| Maximum | 71.2% | 67.8% |
| Range | 63.0% | 66.0% |
| Mean | 38.1% | 26.0% |
| Median | 33.2% | 23.9% |
| Interquartile 25% (IQ1) | 28.1% | 17.2% |
| Interquartile 75% (IQ3) | 50.9% | 28.4% |
| Interquartile Range (IQR) | 22.8% | 11.2% |
| Standard Deviation (Sample) | 17.1% | 14.8% |
| Standard Deviation (Population) | 16.9% | 14.6% |
Similar Demographics by Wage/Income Gap
Demographics Similar to Immigrants from Netherlands by Wage/Income Gap
In terms of wage/income gap, the demographic groups most similar to Immigrants from Netherlands are Immigrants from South Africa (28.5%, a difference of 0.020%), White/Caucasian (28.5%, a difference of 0.060%), Immigrants from Denmark (28.5%, a difference of 0.070%), Scotch-Irish (28.5%, a difference of 0.080%), and Irish (28.5%, a difference of 0.080%).
| Demographics | Rating | Rank | Wage/Income Gap |
| Immigrants | North America | 0.2 /100 | #297 | Tragic 28.4% |
| Austrians | 0.2 /100 | #298 | Tragic 28.4% |
| Immigrants | North Macedonia | 0.2 /100 | #299 | Tragic 28.4% |
| Immigrants | Northern Europe | 0.2 /100 | #300 | Tragic 28.5% |
| Immigrants | Canada | 0.2 /100 | #301 | Tragic 28.5% |
| Scotch-Irish | 0.2 /100 | #302 | Tragic 28.5% |
| Irish | 0.2 /100 | #303 | Tragic 28.5% |
| Immigrants | Netherlands | 0.2 /100 | #304 | Tragic 28.5% |
| Immigrants | South Africa | 0.1 /100 | #305 | Tragic 28.5% |
| Whites/Caucasians | 0.1 /100 | #306 | Tragic 28.5% |
| Immigrants | Denmark | 0.1 /100 | #307 | Tragic 28.5% |
| Poles | 0.1 /100 | #308 | Tragic 28.5% |
| Macedonians | 0.1 /100 | #309 | Tragic 28.6% |
| Finns | 0.1 /100 | #310 | Tragic 28.6% |
| Immigrants | Lithuania | 0.1 /100 | #311 | Tragic 28.6% |
Demographics Similar to Japanese by Wage/Income Gap
In terms of wage/income gap, the demographic groups most similar to Japanese are Immigrants from Laos (23.8%, a difference of 0.14%), Yakama (23.7%, a difference of 0.15%), Aleut (23.7%, a difference of 0.17%), Immigrants from Latin America (23.7%, a difference of 0.25%), and Tsimshian (23.9%, a difference of 0.37%).
| Demographics | Rating | Rank | Wage/Income Gap |
| Hondurans | 99.5 /100 | #94 | Exceptional 23.6% |
| Cape Verdeans | 99.4 /100 | #95 | Exceptional 23.6% |
| Kiowa | 99.4 /100 | #96 | Exceptional 23.6% |
| Immigrants | Sudan | 99.4 /100 | #97 | Exceptional 23.6% |
| Immigrants | Latin America | 99.2 /100 | #98 | Exceptional 23.7% |
| Aleuts | 99.2 /100 | #99 | Exceptional 23.7% |
| Yakama | 99.2 /100 | #100 | Exceptional 23.7% |
| Japanese | 99.1 /100 | #101 | Exceptional 23.8% |
| Immigrants | Laos | 99.0 /100 | #102 | Exceptional 23.8% |
| Tsimshian | 98.9 /100 | #103 | Exceptional 23.9% |
| Tlingit-Haida | 98.7 /100 | #104 | Exceptional 24.0% |
| Moroccans | 98.6 /100 | #105 | Exceptional 24.0% |
| Sudanese | 98.6 /100 | #106 | Exceptional 24.0% |
| Yaqui | 98.4 /100 | #107 | Exceptional 24.0% |
| Immigrants | Albania | 98.4 /100 | #108 | Exceptional 24.0% |