Israeli vs Japanese Wage/Income Gap
COMPARE
Israeli
Japanese
Wage/Income Gap
Wage/Income Gap Comparison
Israelis
Japanese
27.4%
WAGE/INCOME GAP
2.1/ 100
METRIC RATING
254th/ 347
METRIC RANK
23.8%
WAGE/INCOME GAP
99.1/ 100
METRIC RATING
101st/ 347
METRIC RANK
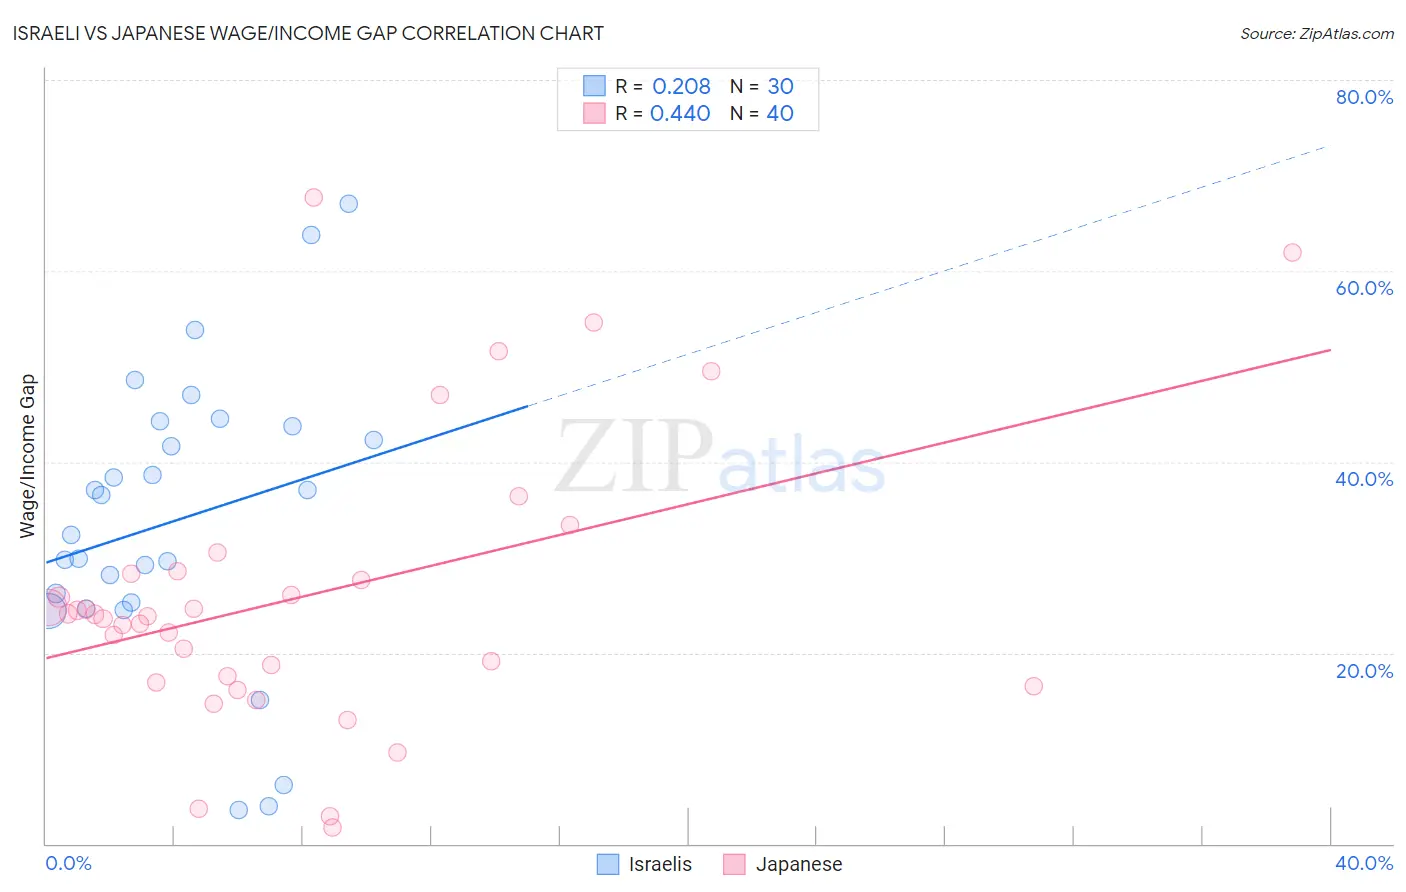
Israeli vs Japanese Wage/Income Gap Correlation Chart
The statistical analysis conducted on geographies consisting of 211,160,371 people shows a weak positive correlation between the proportion of Israelis and wage/income gap percentage in the United States with a correlation coefficient (R) of 0.208 and weighted average of 27.4%. Similarly, the statistical analysis conducted on geographies consisting of 249,130,971 people shows a moderate positive correlation between the proportion of Japanese and wage/income gap percentage in the United States with a correlation coefficient (R) of 0.440 and weighted average of 23.8%, a difference of 15.1%.
Wage/Income Gap Correlation Summary
| Measurement | Israeli | Japanese |
| Minimum | 3.5% | 1.7% |
| Maximum | 67.0% | 67.8% |
| Range | 63.5% | 66.0% |
| Mean | 33.9% | 26.0% |
| Median | 34.4% | 23.9% |
| Interquartile 25% (IQ1) | 25.3% | 17.2% |
| Interquartile 75% (IQ3) | 43.8% | 28.4% |
| Interquartile Range (IQR) | 18.5% | 11.2% |
| Standard Deviation (Sample) | 15.2% | 14.8% |
| Standard Deviation (Population) | 15.0% | 14.6% |
Similar Demographics by Wage/Income Gap
Demographics Similar to Israelis by Wage/Income Gap
In terms of wage/income gap, the demographic groups most similar to Israelis are Immigrants from France (27.4%, a difference of 0.010%), Portuguese (27.4%, a difference of 0.080%), Cherokee (27.4%, a difference of 0.11%), Luxembourger (27.4%, a difference of 0.16%), and Slavic (27.4%, a difference of 0.20%).
| Demographics | Rating | Rank | Wage/Income Gap |
| Celtics | 2.8 /100 | #247 | Tragic 27.3% |
| Cypriots | 2.8 /100 | #248 | Tragic 27.3% |
| Carpatho Rusyns | 2.7 /100 | #249 | Tragic 27.3% |
| Immigrants | Czechoslovakia | 2.7 /100 | #250 | Tragic 27.3% |
| Immigrants | Norway | 2.5 /100 | #251 | Tragic 27.3% |
| Ukrainians | 2.4 /100 | #252 | Tragic 27.3% |
| Portuguese | 2.2 /100 | #253 | Tragic 27.4% |
| Israelis | 2.1 /100 | #254 | Tragic 27.4% |
| Immigrants | France | 2.1 /100 | #255 | Tragic 27.4% |
| Cherokee | 1.9 /100 | #256 | Tragic 27.4% |
| Luxembourgers | 1.9 /100 | #257 | Tragic 27.4% |
| Slavs | 1.8 /100 | #258 | Tragic 27.4% |
| Icelanders | 1.8 /100 | #259 | Tragic 27.5% |
| Tongans | 1.7 /100 | #260 | Tragic 27.5% |
| Immigrants | Germany | 1.5 /100 | #261 | Tragic 27.5% |
Demographics Similar to Japanese by Wage/Income Gap
In terms of wage/income gap, the demographic groups most similar to Japanese are Immigrants from Laos (23.8%, a difference of 0.14%), Yakama (23.7%, a difference of 0.15%), Aleut (23.7%, a difference of 0.17%), Immigrants from Latin America (23.7%, a difference of 0.25%), and Tsimshian (23.9%, a difference of 0.37%).
| Demographics | Rating | Rank | Wage/Income Gap |
| Hondurans | 99.5 /100 | #94 | Exceptional 23.6% |
| Cape Verdeans | 99.4 /100 | #95 | Exceptional 23.6% |
| Kiowa | 99.4 /100 | #96 | Exceptional 23.6% |
| Immigrants | Sudan | 99.4 /100 | #97 | Exceptional 23.6% |
| Immigrants | Latin America | 99.2 /100 | #98 | Exceptional 23.7% |
| Aleuts | 99.2 /100 | #99 | Exceptional 23.7% |
| Yakama | 99.2 /100 | #100 | Exceptional 23.7% |
| Japanese | 99.1 /100 | #101 | Exceptional 23.8% |
| Immigrants | Laos | 99.0 /100 | #102 | Exceptional 23.8% |
| Tsimshian | 98.9 /100 | #103 | Exceptional 23.9% |
| Tlingit-Haida | 98.7 /100 | #104 | Exceptional 24.0% |
| Moroccans | 98.6 /100 | #105 | Exceptional 24.0% |
| Sudanese | 98.6 /100 | #106 | Exceptional 24.0% |
| Yaqui | 98.4 /100 | #107 | Exceptional 24.0% |
| Immigrants | Albania | 98.4 /100 | #108 | Exceptional 24.0% |