Immigrants from Netherlands vs Spaniard Wage/Income Gap
COMPARE
Immigrants from Netherlands
Spaniard
Wage/Income Gap
Wage/Income Gap Comparison
Immigrants from Netherlands
Spaniards
28.5%
WAGE/INCOME GAP
0.2/ 100
METRIC RATING
304th/ 347
METRIC RANK
27.0%
WAGE/INCOME GAP
5.6/ 100
METRIC RATING
227th/ 347
METRIC RANK
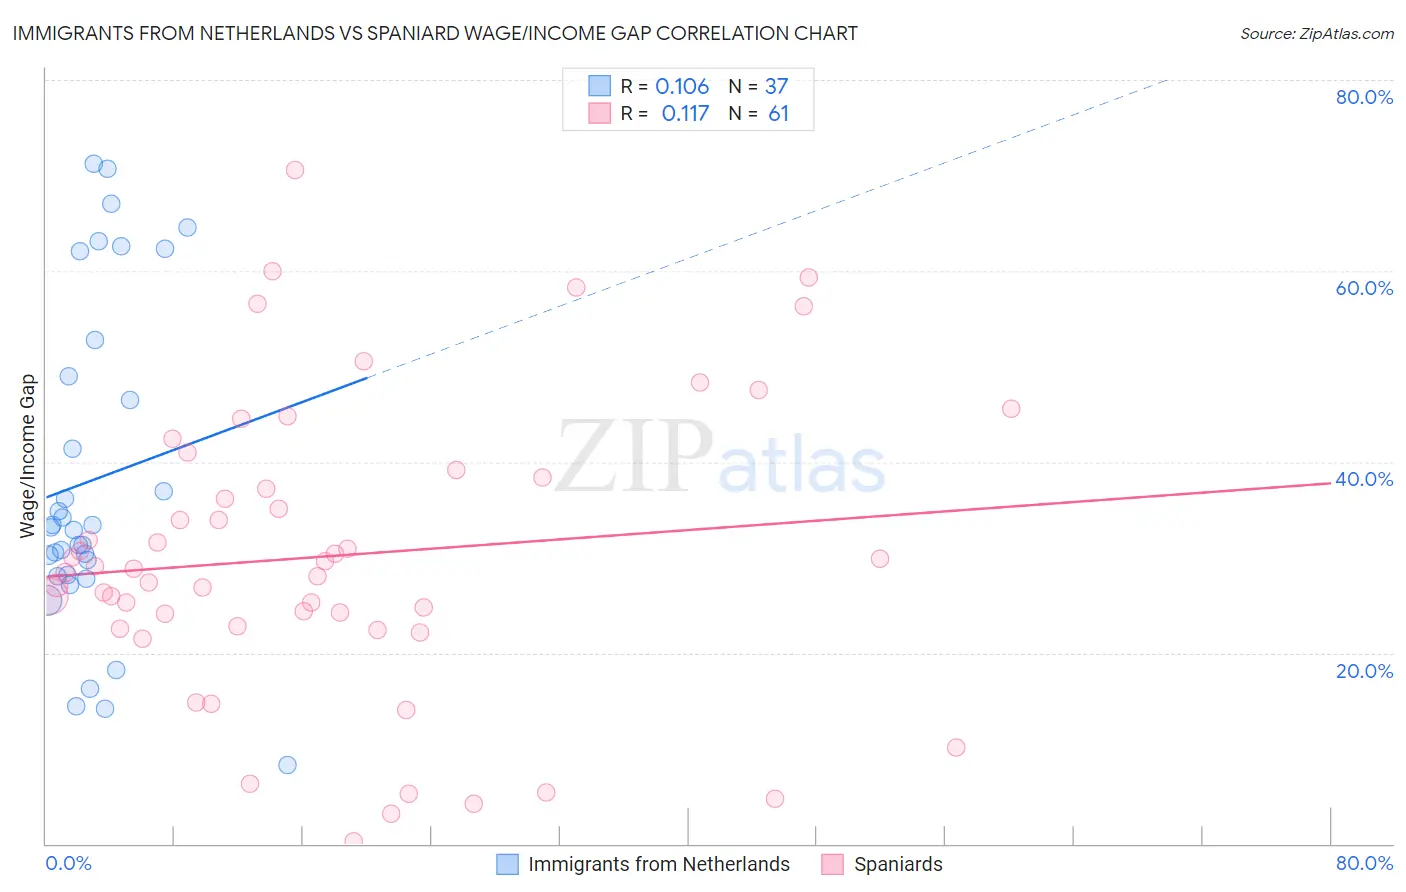
Immigrants from Netherlands vs Spaniard Wage/Income Gap Correlation Chart
The statistical analysis conducted on geographies consisting of 237,766,220 people shows a poor positive correlation between the proportion of Immigrants from Netherlands and wage/income gap percentage in the United States with a correlation coefficient (R) of 0.106 and weighted average of 28.5%. Similarly, the statistical analysis conducted on geographies consisting of 443,034,842 people shows a poor positive correlation between the proportion of Spaniards and wage/income gap percentage in the United States with a correlation coefficient (R) of 0.117 and weighted average of 27.0%, a difference of 5.7%.
Wage/Income Gap Correlation Summary
| Measurement | Immigrants from Netherlands | Spaniard |
| Minimum | 8.2% | 0.29% |
| Maximum | 71.2% | 70.6% |
| Range | 63.0% | 70.3% |
| Mean | 38.1% | 30.2% |
| Median | 33.2% | 28.7% |
| Interquartile 25% (IQ1) | 28.1% | 22.7% |
| Interquartile 75% (IQ3) | 50.9% | 38.8% |
| Interquartile Range (IQR) | 22.8% | 16.1% |
| Standard Deviation (Sample) | 17.1% | 15.4% |
| Standard Deviation (Population) | 16.9% | 15.3% |
Similar Demographics by Wage/Income Gap
Demographics Similar to Immigrants from Netherlands by Wage/Income Gap
In terms of wage/income gap, the demographic groups most similar to Immigrants from Netherlands are Immigrants from South Africa (28.5%, a difference of 0.020%), White/Caucasian (28.5%, a difference of 0.060%), Immigrants from Denmark (28.5%, a difference of 0.070%), Scotch-Irish (28.5%, a difference of 0.080%), and Irish (28.5%, a difference of 0.080%).
| Demographics | Rating | Rank | Wage/Income Gap |
| Immigrants | North America | 0.2 /100 | #297 | Tragic 28.4% |
| Austrians | 0.2 /100 | #298 | Tragic 28.4% |
| Immigrants | North Macedonia | 0.2 /100 | #299 | Tragic 28.4% |
| Immigrants | Northern Europe | 0.2 /100 | #300 | Tragic 28.5% |
| Immigrants | Canada | 0.2 /100 | #301 | Tragic 28.5% |
| Scotch-Irish | 0.2 /100 | #302 | Tragic 28.5% |
| Irish | 0.2 /100 | #303 | Tragic 28.5% |
| Immigrants | Netherlands | 0.2 /100 | #304 | Tragic 28.5% |
| Immigrants | South Africa | 0.1 /100 | #305 | Tragic 28.5% |
| Whites/Caucasians | 0.1 /100 | #306 | Tragic 28.5% |
| Immigrants | Denmark | 0.1 /100 | #307 | Tragic 28.5% |
| Poles | 0.1 /100 | #308 | Tragic 28.5% |
| Macedonians | 0.1 /100 | #309 | Tragic 28.6% |
| Finns | 0.1 /100 | #310 | Tragic 28.6% |
| Immigrants | Lithuania | 0.1 /100 | #311 | Tragic 28.6% |
Demographics Similar to Spaniards by Wage/Income Gap
In terms of wage/income gap, the demographic groups most similar to Spaniards are Immigrants from Turkey (27.0%, a difference of 0.0%), Immigrants from Asia (27.0%, a difference of 0.040%), Asian (26.9%, a difference of 0.080%), Ottawa (27.0%, a difference of 0.090%), and Bhutanese (27.0%, a difference of 0.11%).
| Demographics | Rating | Rank | Wage/Income Gap |
| Immigrants | Latvia | 8.9 /100 | #220 | Tragic 26.7% |
| Immigrants | Spain | 8.5 /100 | #221 | Tragic 26.8% |
| Bolivians | 8.3 /100 | #222 | Tragic 26.8% |
| Jordanians | 8.0 /100 | #223 | Tragic 26.8% |
| Immigrants | Argentina | 7.2 /100 | #224 | Tragic 26.8% |
| Immigrants | Ireland | 6.5 /100 | #225 | Tragic 26.9% |
| Asians | 5.9 /100 | #226 | Tragic 26.9% |
| Spaniards | 5.6 /100 | #227 | Tragic 27.0% |
| Immigrants | Turkey | 5.6 /100 | #228 | Tragic 27.0% |
| Immigrants | Asia | 5.5 /100 | #229 | Tragic 27.0% |
| Ottawa | 5.3 /100 | #230 | Tragic 27.0% |
| Bhutanese | 5.3 /100 | #231 | Tragic 27.0% |
| Argentineans | 5.2 /100 | #232 | Tragic 27.0% |
| Immigrants | Brazil | 5.0 /100 | #233 | Tragic 27.0% |
| Immigrants | Pakistan | 4.9 /100 | #234 | Tragic 27.0% |