Immigrants from Netherlands vs Immigrants from Fiji Wage/Income Gap
COMPARE
Immigrants from Netherlands
Immigrants from Fiji
Wage/Income Gap
Wage/Income Gap Comparison
Immigrants from Netherlands
Immigrants from Fiji
28.5%
WAGE/INCOME GAP
0.2/ 100
METRIC RATING
304th/ 347
METRIC RANK
22.4%
WAGE/INCOME GAP
100.0/ 100
METRIC RATING
61st/ 347
METRIC RANK
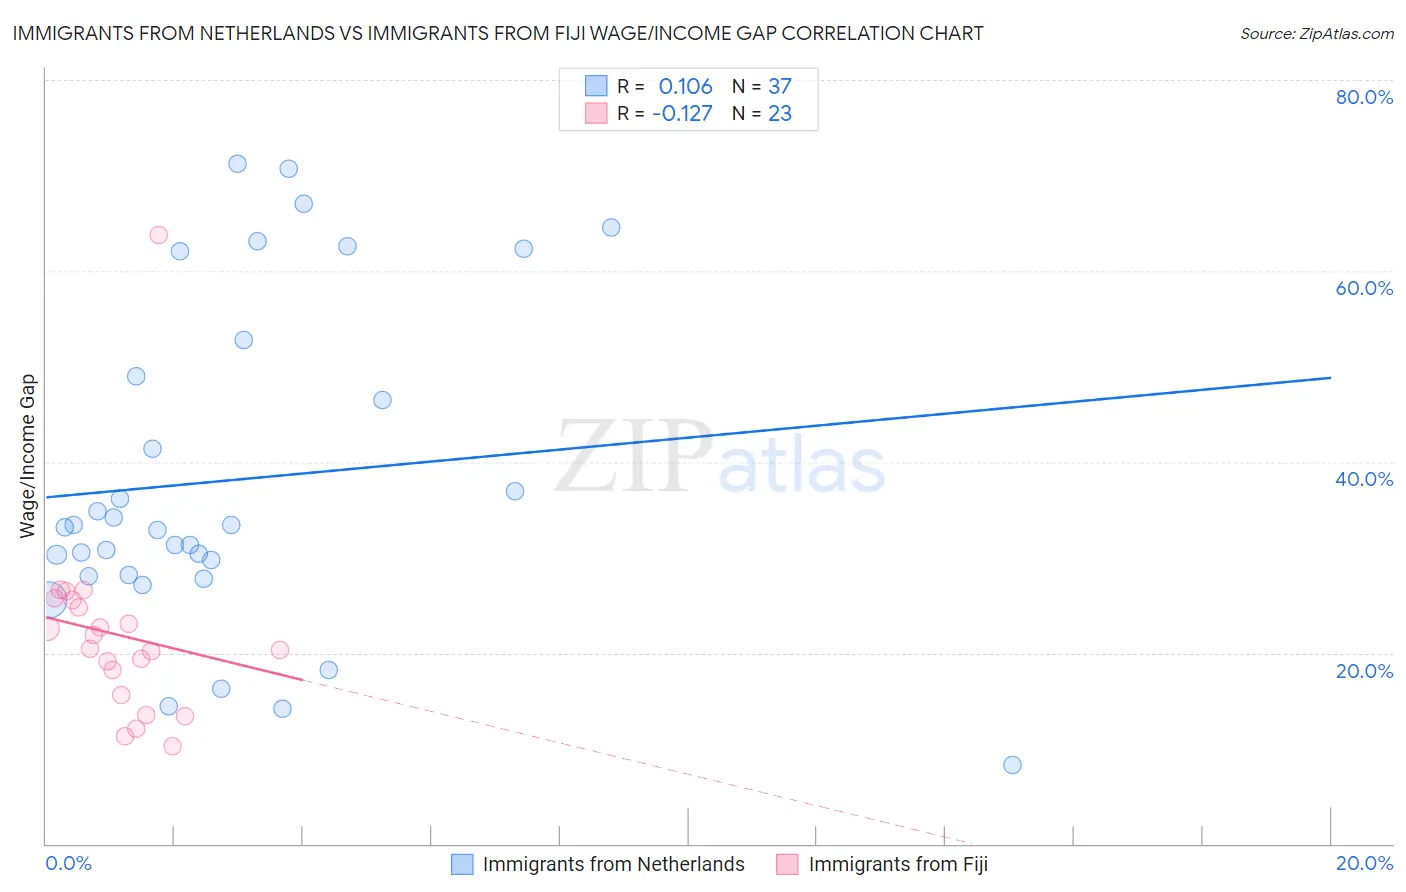
Immigrants from Netherlands vs Immigrants from Fiji Wage/Income Gap Correlation Chart
The statistical analysis conducted on geographies consisting of 237,766,220 people shows a poor positive correlation between the proportion of Immigrants from Netherlands and wage/income gap percentage in the United States with a correlation coefficient (R) of 0.106 and weighted average of 28.5%. Similarly, the statistical analysis conducted on geographies consisting of 93,739,625 people shows a poor negative correlation between the proportion of Immigrants from Fiji and wage/income gap percentage in the United States with a correlation coefficient (R) of -0.127 and weighted average of 22.4%, a difference of 27.2%.
Wage/Income Gap Correlation Summary
| Measurement | Immigrants from Netherlands | Immigrants from Fiji |
| Minimum | 8.2% | 10.2% |
| Maximum | 71.2% | 63.8% |
| Range | 63.0% | 53.5% |
| Mean | 38.1% | 21.9% |
| Median | 33.2% | 20.5% |
| Interquartile 25% (IQ1) | 28.1% | 15.6% |
| Interquartile 75% (IQ3) | 50.9% | 25.6% |
| Interquartile Range (IQR) | 22.8% | 10.0% |
| Standard Deviation (Sample) | 17.1% | 10.5% |
| Standard Deviation (Population) | 16.9% | 10.3% |
Similar Demographics by Wage/Income Gap
Demographics Similar to Immigrants from Netherlands by Wage/Income Gap
In terms of wage/income gap, the demographic groups most similar to Immigrants from Netherlands are Immigrants from South Africa (28.5%, a difference of 0.020%), White/Caucasian (28.5%, a difference of 0.060%), Immigrants from Denmark (28.5%, a difference of 0.070%), Scotch-Irish (28.5%, a difference of 0.080%), and Irish (28.5%, a difference of 0.080%).
| Demographics | Rating | Rank | Wage/Income Gap |
| Immigrants | North America | 0.2 /100 | #297 | Tragic 28.4% |
| Austrians | 0.2 /100 | #298 | Tragic 28.4% |
| Immigrants | North Macedonia | 0.2 /100 | #299 | Tragic 28.4% |
| Immigrants | Northern Europe | 0.2 /100 | #300 | Tragic 28.5% |
| Immigrants | Canada | 0.2 /100 | #301 | Tragic 28.5% |
| Scotch-Irish | 0.2 /100 | #302 | Tragic 28.5% |
| Irish | 0.2 /100 | #303 | Tragic 28.5% |
| Immigrants | Netherlands | 0.2 /100 | #304 | Tragic 28.5% |
| Immigrants | South Africa | 0.1 /100 | #305 | Tragic 28.5% |
| Whites/Caucasians | 0.1 /100 | #306 | Tragic 28.5% |
| Immigrants | Denmark | 0.1 /100 | #307 | Tragic 28.5% |
| Poles | 0.1 /100 | #308 | Tragic 28.5% |
| Macedonians | 0.1 /100 | #309 | Tragic 28.6% |
| Finns | 0.1 /100 | #310 | Tragic 28.6% |
| Immigrants | Lithuania | 0.1 /100 | #311 | Tragic 28.6% |
Demographics Similar to Immigrants from Fiji by Wage/Income Gap
In terms of wage/income gap, the demographic groups most similar to Immigrants from Fiji are Immigrants from Middle Africa (22.4%, a difference of 0.17%), Navajo (22.4%, a difference of 0.19%), Immigrants from Guatemala (22.5%, a difference of 0.21%), Immigrants from Cuba (22.4%, a difference of 0.23%), and Ghanaian (22.3%, a difference of 0.31%).
| Demographics | Rating | Rank | Wage/Income Gap |
| Nepalese | 100.0 /100 | #54 | Exceptional 22.2% |
| Immigrants | Zaire | 100.0 /100 | #55 | Exceptional 22.3% |
| Immigrants | Ghana | 100.0 /100 | #56 | Exceptional 22.3% |
| Ghanaians | 100.0 /100 | #57 | Exceptional 22.3% |
| Immigrants | Cuba | 100.0 /100 | #58 | Exceptional 22.4% |
| Navajo | 100.0 /100 | #59 | Exceptional 22.4% |
| Immigrants | Middle Africa | 100.0 /100 | #60 | Exceptional 22.4% |
| Immigrants | Fiji | 100.0 /100 | #61 | Exceptional 22.4% |
| Immigrants | Guatemala | 100.0 /100 | #62 | Exceptional 22.5% |
| Immigrants | Ecuador | 100.0 /100 | #63 | Exceptional 22.5% |
| Spanish American Indians | 100.0 /100 | #64 | Exceptional 22.5% |
| Guatemalans | 99.9 /100 | #65 | Exceptional 22.6% |
| Central American Indians | 99.9 /100 | #66 | Exceptional 22.7% |
| Menominee | 99.9 /100 | #67 | Exceptional 22.7% |
| Immigrants | Nigeria | 99.9 /100 | #68 | Exceptional 22.7% |