Immigrants from Netherlands vs Immigrants from Fiji Single Male Poverty
COMPARE
Immigrants from Netherlands
Immigrants from Fiji
Single Male Poverty
Single Male Poverty Comparison
Immigrants from Netherlands
Immigrants from Fiji
12.5%
SINGLE MALE POVERTY
86.2/ 100
METRIC RATING
127th/ 347
METRIC RANK
10.9%
SINGLE MALE POVERTY
100.0/ 100
METRIC RATING
10th/ 347
METRIC RANK
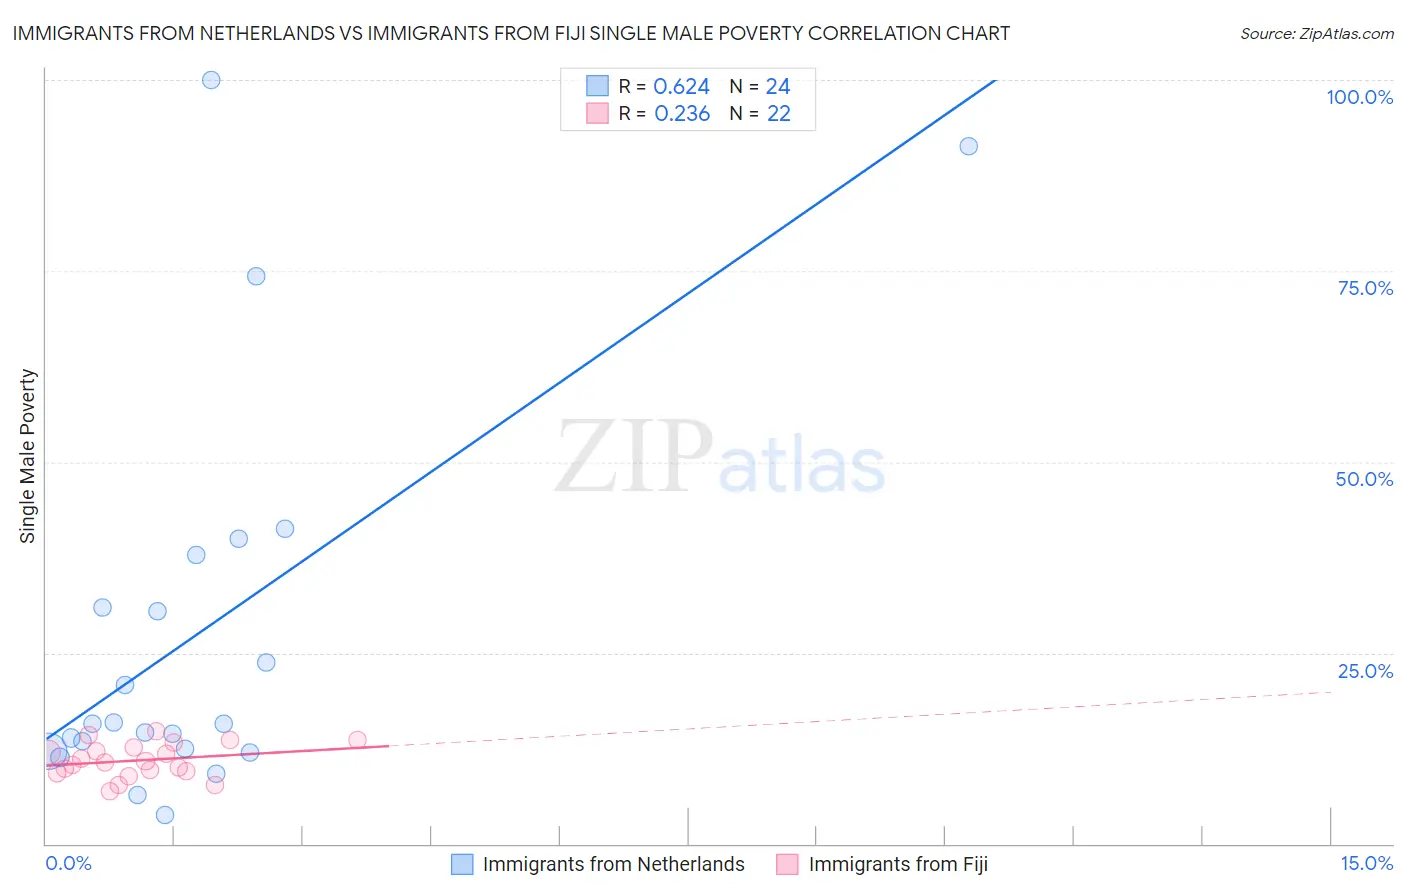
Immigrants from Netherlands vs Immigrants from Fiji Single Male Poverty Correlation Chart
The statistical analysis conducted on geographies consisting of 216,285,170 people shows a significant positive correlation between the proportion of Immigrants from Netherlands and poverty level among single males in the United States with a correlation coefficient (R) of 0.624 and weighted average of 12.5%. Similarly, the statistical analysis conducted on geographies consisting of 90,653,076 people shows a weak positive correlation between the proportion of Immigrants from Fiji and poverty level among single males in the United States with a correlation coefficient (R) of 0.236 and weighted average of 10.9%, a difference of 14.6%.
Single Male Poverty Correlation Summary
| Measurement | Immigrants from Netherlands | Immigrants from Fiji |
| Minimum | 3.8% | 6.8% |
| Maximum | 100.0% | 14.7% |
| Range | 96.2% | 7.9% |
| Mean | 27.6% | 10.9% |
| Median | 15.7% | 10.7% |
| Interquartile 25% (IQ1) | 12.3% | 9.5% |
| Interquartile 75% (IQ3) | 34.4% | 12.6% |
| Interquartile Range (IQR) | 22.1% | 3.1% |
| Standard Deviation (Sample) | 26.0% | 2.2% |
| Standard Deviation (Population) | 25.4% | 2.2% |
Similar Demographics by Single Male Poverty
Demographics Similar to Immigrants from Netherlands by Single Male Poverty
In terms of single male poverty, the demographic groups most similar to Immigrants from Netherlands are Romanian (12.5%, a difference of 0.010%), Ecuadorian (12.5%, a difference of 0.040%), Immigrants from Sierra Leone (12.5%, a difference of 0.080%), Immigrants from Jordan (12.5%, a difference of 0.10%), and Russian (12.5%, a difference of 0.13%).
| Demographics | Rating | Rank | Single Male Poverty |
| Venezuelans | 89.4 /100 | #120 | Excellent 12.4% |
| Icelanders | 88.2 /100 | #121 | Excellent 12.5% |
| Serbians | 87.9 /100 | #122 | Excellent 12.5% |
| Immigrants | Kenya | 87.6 /100 | #123 | Excellent 12.5% |
| Russians | 87.3 /100 | #124 | Excellent 12.5% |
| Immigrants | Jordan | 87.1 /100 | #125 | Excellent 12.5% |
| Romanians | 86.4 /100 | #126 | Excellent 12.5% |
| Immigrants | Netherlands | 86.2 /100 | #127 | Excellent 12.5% |
| Ecuadorians | 85.9 /100 | #128 | Excellent 12.5% |
| Immigrants | Sierra Leone | 85.5 /100 | #129 | Excellent 12.5% |
| Immigrants | Nicaragua | 84.8 /100 | #130 | Excellent 12.5% |
| Immigrants | Northern Europe | 83.7 /100 | #131 | Excellent 12.5% |
| Salvadorans | 83.7 /100 | #132 | Excellent 12.5% |
| Immigrants | Western Asia | 83.4 /100 | #133 | Excellent 12.5% |
| Immigrants | Ecuador | 82.1 /100 | #134 | Excellent 12.5% |
Demographics Similar to Immigrants from Fiji by Single Male Poverty
In terms of single male poverty, the demographic groups most similar to Immigrants from Fiji are Immigrants from Philippines (10.9%, a difference of 0.020%), Taiwanese (10.9%, a difference of 0.050%), Immigrants from Afghanistan (10.9%, a difference of 0.090%), Immigrants from South Central Asia (10.9%, a difference of 0.22%), and Chinese (11.0%, a difference of 0.78%).
| Demographics | Rating | Rank | Single Male Poverty |
| Immigrants | India | 100.0 /100 | #3 | Exceptional 10.3% |
| Immigrants | Hong Kong | 100.0 /100 | #4 | Exceptional 10.4% |
| Tongans | 100.0 /100 | #5 | Exceptional 10.5% |
| Filipinos | 100.0 /100 | #6 | Exceptional 10.6% |
| Afghans | 100.0 /100 | #7 | Exceptional 10.7% |
| Thais | 100.0 /100 | #8 | Exceptional 10.8% |
| Taiwanese | 100.0 /100 | #9 | Exceptional 10.9% |
| Immigrants | Fiji | 100.0 /100 | #10 | Exceptional 10.9% |
| Immigrants | Philippines | 100.0 /100 | #11 | Exceptional 10.9% |
| Immigrants | Afghanistan | 100.0 /100 | #12 | Exceptional 10.9% |
| Immigrants | South Central Asia | 100.0 /100 | #13 | Exceptional 10.9% |
| Chinese | 100.0 /100 | #14 | Exceptional 11.0% |
| Koreans | 100.0 /100 | #15 | Exceptional 11.0% |
| Bhutanese | 100.0 /100 | #16 | Exceptional 11.1% |
| Tsimshian | 100.0 /100 | #17 | Exceptional 11.1% |