Dutch vs Liberian Wage/Income Gap
COMPARE
Dutch
Liberian
Wage/Income Gap
Wage/Income Gap Comparison
Dutch
Liberians
29.6%
WAGE/INCOME GAP
0.0/ 100
METRIC RATING
337th/ 347
METRIC RANK
21.4%
WAGE/INCOME GAP
100.0/ 100
METRIC RATING
41st/ 347
METRIC RANK
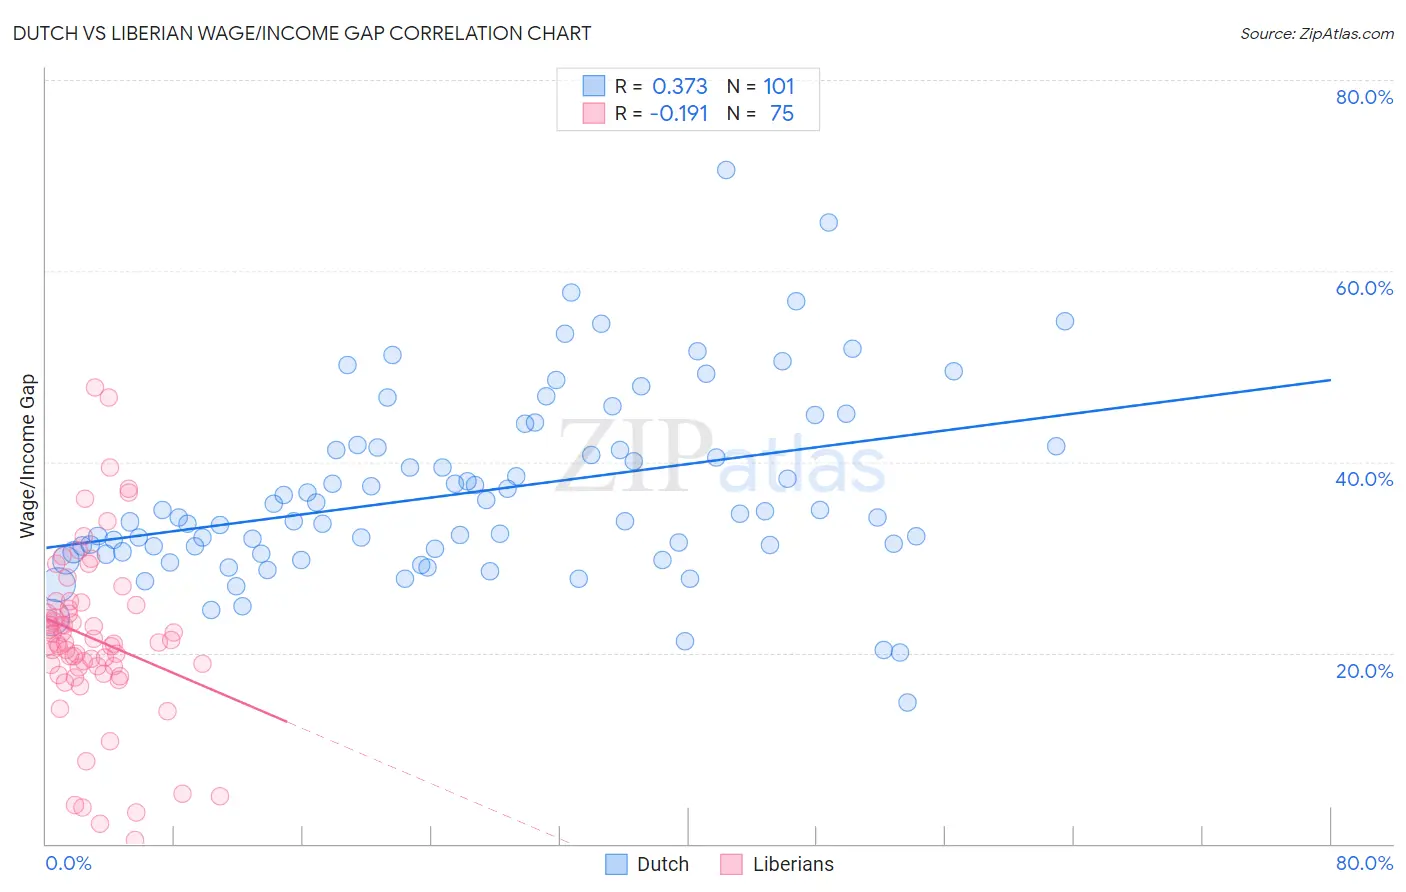
Dutch vs Liberian Wage/Income Gap Correlation Chart
The statistical analysis conducted on geographies consisting of 552,244,152 people shows a mild positive correlation between the proportion of Dutch and wage/income gap percentage in the United States with a correlation coefficient (R) of 0.373 and weighted average of 29.6%. Similarly, the statistical analysis conducted on geographies consisting of 118,089,218 people shows a poor negative correlation between the proportion of Liberians and wage/income gap percentage in the United States with a correlation coefficient (R) of -0.191 and weighted average of 21.4%, a difference of 38.3%.
Wage/Income Gap Correlation Summary
| Measurement | Dutch | Liberian |
| Minimum | 14.8% | 0.44% |
| Maximum | 70.6% | 47.8% |
| Range | 55.8% | 47.4% |
| Mean | 36.8% | 21.5% |
| Median | 34.2% | 21.0% |
| Interquartile 25% (IQ1) | 30.6% | 18.5% |
| Interquartile 75% (IQ3) | 41.5% | 25.0% |
| Interquartile Range (IQR) | 11.0% | 6.5% |
| Standard Deviation (Sample) | 9.7% | 9.0% |
| Standard Deviation (Population) | 9.7% | 9.0% |
Similar Demographics by Wage/Income Gap
Demographics Similar to Dutch by Wage/Income Gap
In terms of wage/income gap, the demographic groups most similar to Dutch are Filipino (29.7%, a difference of 0.22%), Iranian (29.7%, a difference of 0.28%), English (29.5%, a difference of 0.58%), Immigrants from Taiwan (29.5%, a difference of 0.59%), and Swedish (29.4%, a difference of 0.72%).
| Demographics | Rating | Rank | Wage/Income Gap |
| Germans | 0.0 /100 | #330 | Tragic 29.2% |
| Czechs | 0.0 /100 | #331 | Tragic 29.2% |
| Immigrants | South Central Asia | 0.0 /100 | #332 | Tragic 29.3% |
| Europeans | 0.0 /100 | #333 | Tragic 29.4% |
| Swedes | 0.0 /100 | #334 | Tragic 29.4% |
| Immigrants | Taiwan | 0.0 /100 | #335 | Tragic 29.5% |
| English | 0.0 /100 | #336 | Tragic 29.5% |
| Dutch | 0.0 /100 | #337 | Tragic 29.6% |
| Filipinos | 0.0 /100 | #338 | Tragic 29.7% |
| Iranians | 0.0 /100 | #339 | Tragic 29.7% |
| Swiss | 0.0 /100 | #340 | Tragic 30.0% |
| Thais | 0.0 /100 | #341 | Tragic 30.5% |
| Pennsylvania Germans | 0.0 /100 | #342 | Tragic 30.7% |
| Danes | 0.0 /100 | #343 | Tragic 31.0% |
| Assyrians/Chaldeans/Syriacs | 0.0 /100 | #344 | Tragic 31.0% |
Demographics Similar to Liberians by Wage/Income Gap
In terms of wage/income gap, the demographic groups most similar to Liberians are Immigrants from Sierra Leone (21.4%, a difference of 0.0%), Sierra Leonean (21.4%, a difference of 0.060%), Immigrants from Eritrea (21.4%, a difference of 0.080%), Lumbee (21.3%, a difference of 0.48%), and U.S. Virgin Islander (21.5%, a difference of 0.52%).
| Demographics | Rating | Rank | Wage/Income Gap |
| Pima | 100.0 /100 | #34 | Exceptional 21.1% |
| Somalis | 100.0 /100 | #35 | Exceptional 21.2% |
| Belizeans | 100.0 /100 | #36 | Exceptional 21.2% |
| Immigrants | Somalia | 100.0 /100 | #37 | Exceptional 21.2% |
| Immigrants | Belize | 100.0 /100 | #38 | Exceptional 21.3% |
| Colville | 100.0 /100 | #39 | Exceptional 21.3% |
| Lumbee | 100.0 /100 | #40 | Exceptional 21.3% |
| Liberians | 100.0 /100 | #41 | Exceptional 21.4% |
| Immigrants | Sierra Leone | 100.0 /100 | #42 | Exceptional 21.4% |
| Sierra Leoneans | 100.0 /100 | #43 | Exceptional 21.4% |
| Immigrants | Eritrea | 100.0 /100 | #44 | Exceptional 21.4% |
| U.S. Virgin Islanders | 100.0 /100 | #45 | Exceptional 21.5% |
| Immigrants | Ethiopia | 100.0 /100 | #46 | Exceptional 21.6% |
| Immigrants | Congo | 100.0 /100 | #47 | Exceptional 21.7% |
| Blacks/African Americans | 100.0 /100 | #48 | Exceptional 21.7% |