Immigrants from Moldova vs Liberian Median Family Income
COMPARE
Immigrants from Moldova
Liberian
Median Family Income
Median Family Income Comparison
Immigrants from Moldova
Liberians
$109,975
MEDIAN FAMILY INCOME
97.7/ 100
METRIC RATING
96th/ 347
METRIC RANK
$91,722
MEDIAN FAMILY INCOME
0.4/ 100
METRIC RATING
262nd/ 347
METRIC RANK
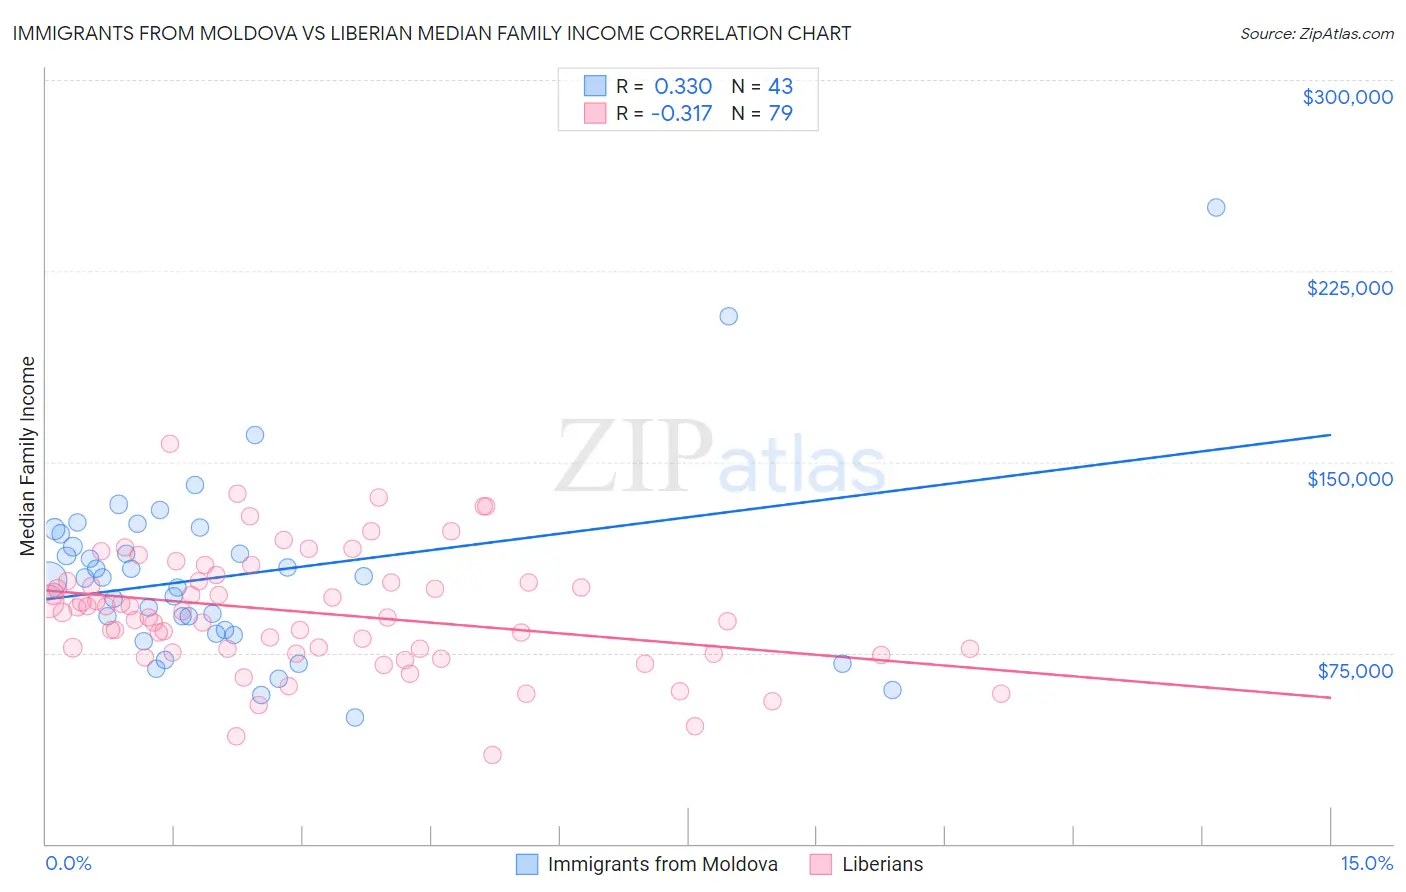
Immigrants from Moldova vs Liberian Median Family Income Correlation Chart
The statistical analysis conducted on geographies consisting of 124,358,975 people shows a mild positive correlation between the proportion of Immigrants from Moldova and median family income in the United States with a correlation coefficient (R) of 0.330 and weighted average of $109,975. Similarly, the statistical analysis conducted on geographies consisting of 118,024,273 people shows a mild negative correlation between the proportion of Liberians and median family income in the United States with a correlation coefficient (R) of -0.317 and weighted average of $91,722, a difference of 19.9%.
Median Family Income Correlation Summary
| Measurement | Immigrants from Moldova | Liberian |
| Minimum | $49,474 | $34,978 |
| Maximum | $250,001 | $157,083 |
| Range | $200,527 | $122,105 |
| Mean | $105,716 | $90,813 |
| Median | $104,398 | $90,810 |
| Interquartile 25% (IQ1) | $82,625 | $74,960 |
| Interquartile 75% (IQ3) | $121,587 | $103,000 |
| Interquartile Range (IQR) | $38,962 | $28,040 |
| Standard Deviation (Sample) | $36,710 | $23,045 |
| Standard Deviation (Population) | $36,280 | $22,899 |
Similar Demographics by Median Family Income
Demographics Similar to Immigrants from Moldova by Median Family Income
In terms of median family income, the demographic groups most similar to Immigrants from Moldova are Zimbabwean ($110,011, a difference of 0.030%), Jordanian ($109,865, a difference of 0.10%), Korean ($110,103, a difference of 0.12%), Immigrants from Kazakhstan ($110,137, a difference of 0.15%), and Immigrants from Lebanon ($110,159, a difference of 0.17%).
| Demographics | Rating | Rank | Median Family Income |
| Immigrants | Argentina | 98.5 /100 | #89 | Exceptional $110,873 |
| Northern Europeans | 98.3 /100 | #90 | Exceptional $110,635 |
| Immigrants | Southern Europe | 98.3 /100 | #91 | Exceptional $110,614 |
| Immigrants | Lebanon | 97.9 /100 | #92 | Exceptional $110,159 |
| Immigrants | Kazakhstan | 97.8 /100 | #93 | Exceptional $110,137 |
| Koreans | 97.8 /100 | #94 | Exceptional $110,103 |
| Zimbabweans | 97.7 /100 | #95 | Exceptional $110,011 |
| Immigrants | Moldova | 97.7 /100 | #96 | Exceptional $109,975 |
| Jordanians | 97.5 /100 | #97 | Exceptional $109,865 |
| Immigrants | Kuwait | 97.4 /100 | #98 | Exceptional $109,731 |
| Armenians | 97.3 /100 | #99 | Exceptional $109,692 |
| Macedonians | 97.3 /100 | #100 | Exceptional $109,668 |
| Immigrants | Ukraine | 97.2 /100 | #101 | Exceptional $109,645 |
| Assyrians/Chaldeans/Syriacs | 97.2 /100 | #102 | Exceptional $109,622 |
| Immigrants | Brazil | 96.9 /100 | #103 | Exceptional $109,418 |
Demographics Similar to Liberians by Median Family Income
In terms of median family income, the demographic groups most similar to Liberians are Inupiat ($91,730, a difference of 0.010%), Pennsylvania German ($91,763, a difference of 0.040%), Cape Verdean ($91,848, a difference of 0.14%), Immigrants from West Indies ($91,588, a difference of 0.15%), and Osage ($91,926, a difference of 0.22%).
| Demographics | Rating | Rank | Median Family Income |
| Immigrants | Laos | 0.5 /100 | #255 | Tragic $92,239 |
| Nicaraguans | 0.5 /100 | #256 | Tragic $92,231 |
| Americans | 0.4 /100 | #257 | Tragic $92,096 |
| Osage | 0.4 /100 | #258 | Tragic $91,926 |
| Cape Verdeans | 0.4 /100 | #259 | Tragic $91,848 |
| Pennsylvania Germans | 0.4 /100 | #260 | Tragic $91,763 |
| Inupiat | 0.4 /100 | #261 | Tragic $91,730 |
| Liberians | 0.4 /100 | #262 | Tragic $91,722 |
| Immigrants | West Indies | 0.3 /100 | #263 | Tragic $91,588 |
| Senegalese | 0.3 /100 | #264 | Tragic $91,475 |
| Hmong | 0.3 /100 | #265 | Tragic $91,296 |
| Central Americans | 0.3 /100 | #266 | Tragic $91,087 |
| Mexican American Indians | 0.2 /100 | #267 | Tragic $90,918 |
| Cree | 0.2 /100 | #268 | Tragic $90,882 |
| Belizeans | 0.2 /100 | #269 | Tragic $90,880 |