Immigrants from Moldova vs Immigrants from Taiwan Female Poverty Among 25-34 Year Olds
COMPARE
Immigrants from Moldova
Immigrants from Taiwan
Female Poverty Among 25-34 Year Olds
Female Poverty Among 25-34 Year Olds Comparison
Immigrants from Moldova
Immigrants from Taiwan
12.1%
FEMALE POVERTY AMONG 25-34 YEAR OLDS
99.3/ 100
METRIC RATING
62nd/ 347
METRIC RANK
10.0%
FEMALE POVERTY AMONG 25-34 YEAR OLDS
100.0/ 100
METRIC RATING
2nd/ 347
METRIC RANK
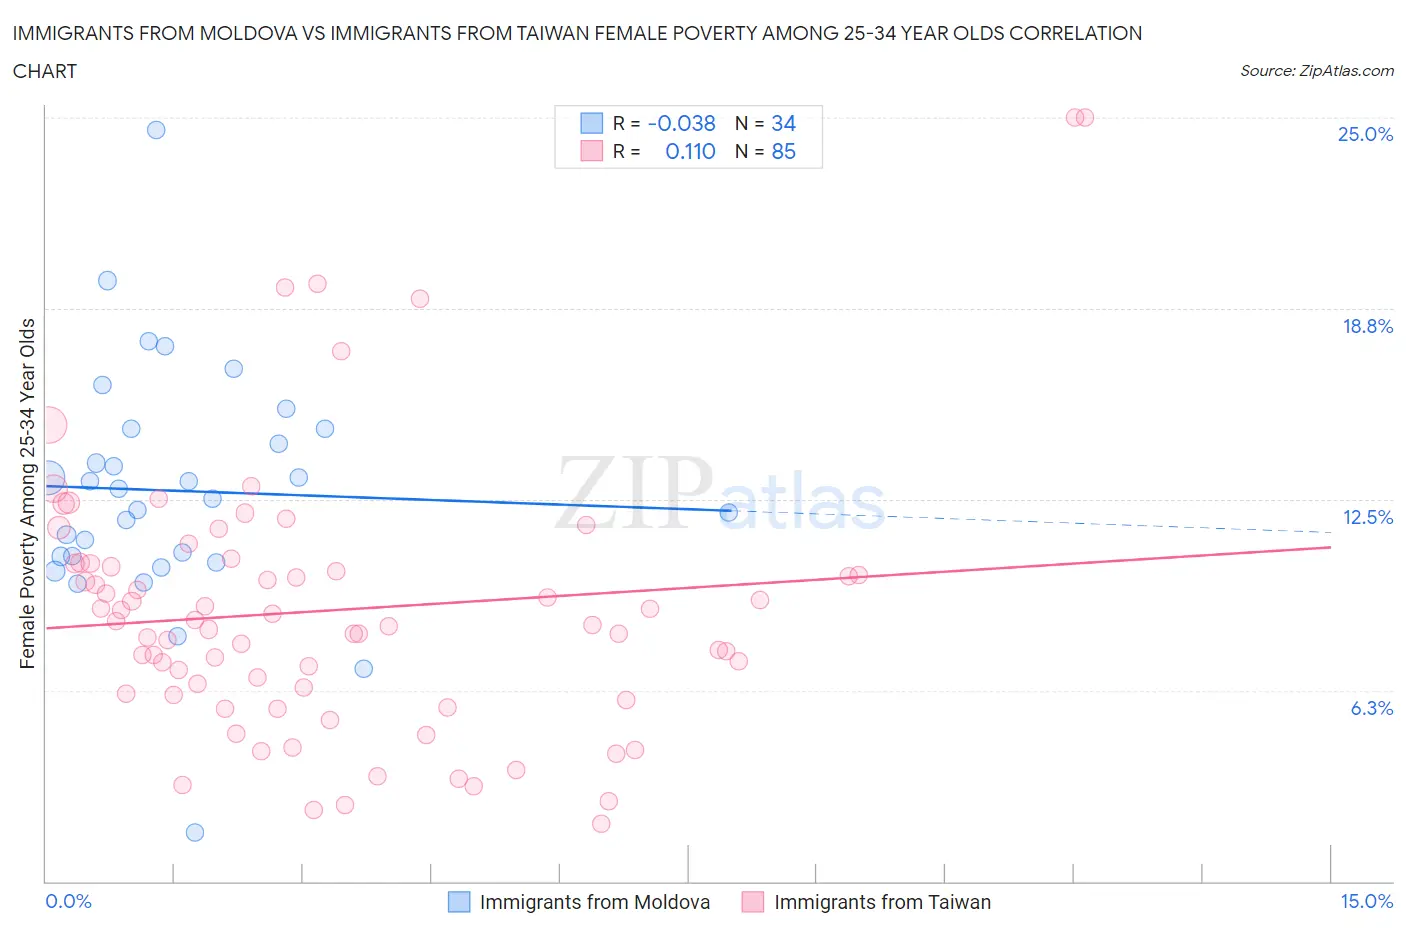
Immigrants from Moldova vs Immigrants from Taiwan Female Poverty Among 25-34 Year Olds Correlation Chart
The statistical analysis conducted on geographies consisting of 123,404,281 people shows no correlation between the proportion of Immigrants from Moldova and poverty level among females between the ages 25 and 34 in the United States with a correlation coefficient (R) of -0.038 and weighted average of 12.1%. Similarly, the statistical analysis conducted on geographies consisting of 293,956,409 people shows a poor positive correlation between the proportion of Immigrants from Taiwan and poverty level among females between the ages 25 and 34 in the United States with a correlation coefficient (R) of 0.110 and weighted average of 10.0%, a difference of 21.2%.
Female Poverty Among 25-34 Year Olds Correlation Summary
| Measurement | Immigrants from Moldova | Immigrants from Taiwan |
| Minimum | 1.6% | 1.9% |
| Maximum | 24.6% | 25.0% |
| Range | 23.0% | 23.1% |
| Mean | 12.8% | 8.9% |
| Median | 12.7% | 8.4% |
| Interquartile 25% (IQ1) | 10.6% | 6.1% |
| Interquartile 75% (IQ3) | 14.8% | 10.4% |
| Interquartile Range (IQR) | 4.2% | 4.3% |
| Standard Deviation (Sample) | 4.0% | 4.4% |
| Standard Deviation (Population) | 3.9% | 4.4% |
Similar Demographics by Female Poverty Among 25-34 Year Olds
Demographics Similar to Immigrants from Moldova by Female Poverty Among 25-34 Year Olds
In terms of female poverty among 25-34 year olds, the demographic groups most similar to Immigrants from Moldova are Soviet Union (12.1%, a difference of 0.010%), Immigrants from Czechoslovakia (12.1%, a difference of 0.17%), Immigrants from Northern Europe (12.1%, a difference of 0.19%), Immigrants from Russia (12.2%, a difference of 0.25%), and Armenian (12.2%, a difference of 0.27%).
| Demographics | Rating | Rank | Female Poverty Among 25-34 Year Olds |
| Immigrants | Philippines | 99.5 /100 | #55 | Exceptional 12.0% |
| Luxembourgers | 99.5 /100 | #56 | Exceptional 12.1% |
| Jordanians | 99.4 /100 | #57 | Exceptional 12.1% |
| Immigrants | Romania | 99.4 /100 | #58 | Exceptional 12.1% |
| Russians | 99.4 /100 | #59 | Exceptional 12.1% |
| Immigrants | Northern Europe | 99.4 /100 | #60 | Exceptional 12.1% |
| Immigrants | Czechoslovakia | 99.4 /100 | #61 | Exceptional 12.1% |
| Immigrants | Moldova | 99.3 /100 | #62 | Exceptional 12.1% |
| Soviet Union | 99.3 /100 | #63 | Exceptional 12.1% |
| Immigrants | Russia | 99.2 /100 | #64 | Exceptional 12.2% |
| Armenians | 99.2 /100 | #65 | Exceptional 12.2% |
| Immigrants | Europe | 99.2 /100 | #66 | Exceptional 12.2% |
| Laotians | 99.2 /100 | #67 | Exceptional 12.2% |
| Sri Lankans | 99.1 /100 | #68 | Exceptional 12.2% |
| Immigrants | Lebanon | 99.1 /100 | #69 | Exceptional 12.2% |
Demographics Similar to Immigrants from Taiwan by Female Poverty Among 25-34 Year Olds
In terms of female poverty among 25-34 year olds, the demographic groups most similar to Immigrants from Taiwan are Filipino (10.2%, a difference of 2.1%), Thai (10.2%, a difference of 2.2%), Immigrants from India (9.7%, a difference of 3.1%), Immigrants from Hong Kong (10.4%, a difference of 3.6%), and Immigrants from South Central Asia (10.8%, a difference of 7.4%).
| Demographics | Rating | Rank | Female Poverty Among 25-34 Year Olds |
| Immigrants | India | 100.0 /100 | #1 | Exceptional 9.7% |
| Immigrants | Taiwan | 100.0 /100 | #2 | Exceptional 10.0% |
| Filipinos | 100.0 /100 | #3 | Exceptional 10.2% |
| Thais | 100.0 /100 | #4 | Exceptional 10.2% |
| Immigrants | Hong Kong | 100.0 /100 | #5 | Exceptional 10.4% |
| Immigrants | South Central Asia | 100.0 /100 | #6 | Exceptional 10.8% |
| Chinese | 100.0 /100 | #7 | Exceptional 11.0% |
| Immigrants | Iran | 100.0 /100 | #8 | Exceptional 11.0% |
| Immigrants | Singapore | 100.0 /100 | #9 | Exceptional 11.1% |
| Immigrants | Lithuania | 100.0 /100 | #10 | Exceptional 11.1% |
| Immigrants | Korea | 100.0 /100 | #11 | Exceptional 11.1% |
| Immigrants | Ireland | 100.0 /100 | #12 | Exceptional 11.2% |
| Burmese | 100.0 /100 | #13 | Exceptional 11.2% |
| Indians (Asian) | 100.0 /100 | #14 | Exceptional 11.2% |
| Assyrians/Chaldeans/Syriacs | 100.0 /100 | #15 | Exceptional 11.2% |