Immigrants from Scotland vs Croatian Wage/Income Gap
COMPARE
Immigrants from Scotland
Croatian
Wage/Income Gap
Wage/Income Gap Comparison
Immigrants from Scotland
Croatians
28.7%
WAGE/INCOME GAP
0.1/ 100
METRIC RATING
314th/ 347
METRIC RANK
29.0%
WAGE/INCOME GAP
0.0/ 100
METRIC RATING
324th/ 347
METRIC RANK
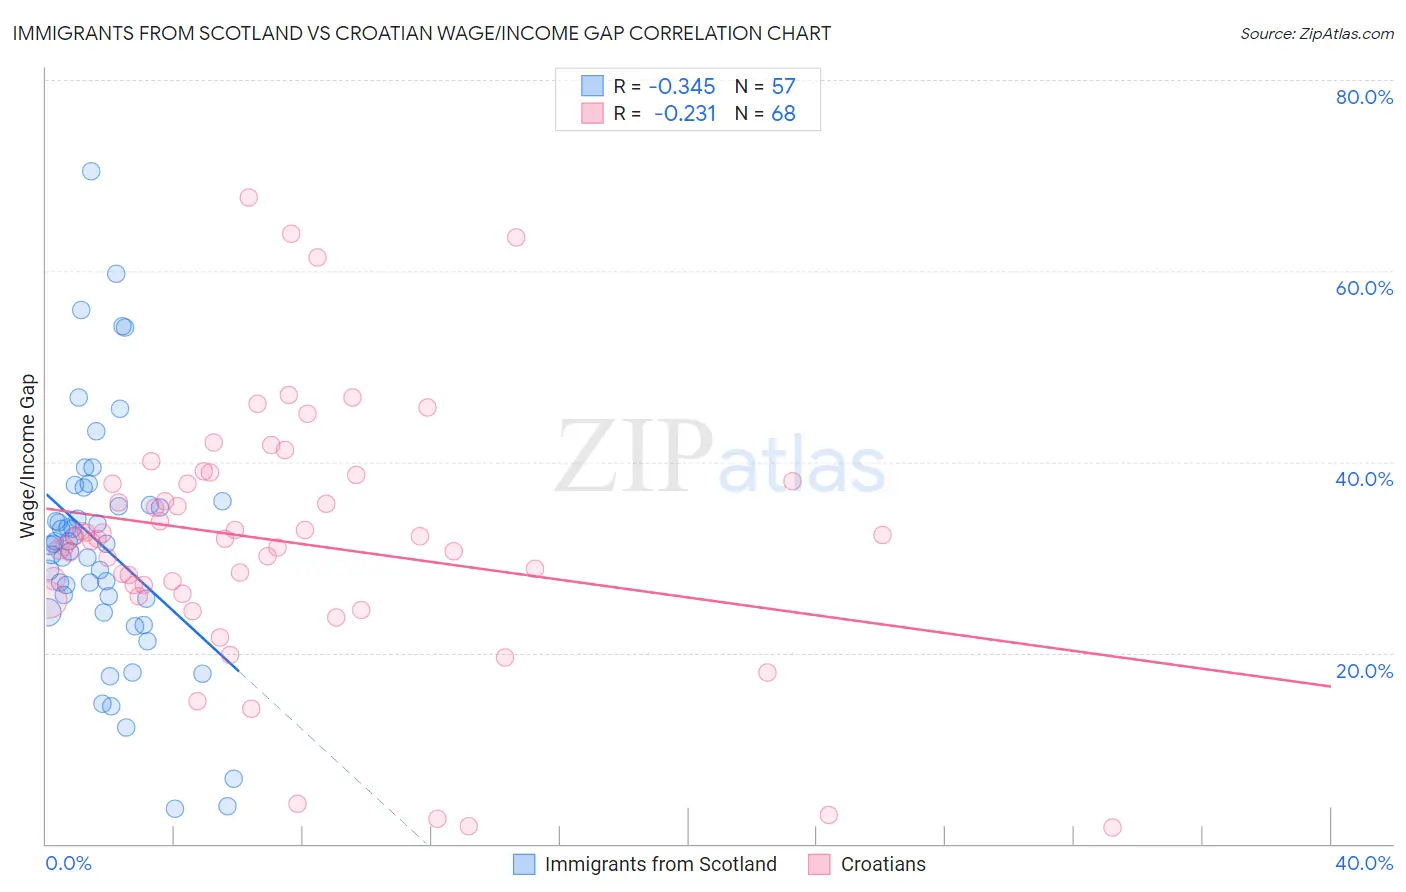
Immigrants from Scotland vs Croatian Wage/Income Gap Correlation Chart
The statistical analysis conducted on geographies consisting of 196,317,574 people shows a mild negative correlation between the proportion of Immigrants from Scotland and wage/income gap percentage in the United States with a correlation coefficient (R) of -0.345 and weighted average of 28.7%. Similarly, the statistical analysis conducted on geographies consisting of 375,417,057 people shows a weak negative correlation between the proportion of Croatians and wage/income gap percentage in the United States with a correlation coefficient (R) of -0.231 and weighted average of 29.0%, a difference of 0.91%.
Wage/Income Gap Correlation Summary
| Measurement | Immigrants from Scotland | Croatian |
| Minimum | 3.7% | 1.8% |
| Maximum | 70.5% | 67.7% |
| Range | 66.8% | 65.9% |
| Mean | 31.2% | 31.7% |
| Median | 31.4% | 31.9% |
| Interquartile 25% (IQ1) | 24.9% | 26.6% |
| Interquartile 75% (IQ3) | 35.7% | 37.8% |
| Interquartile Range (IQR) | 10.7% | 11.2% |
| Standard Deviation (Sample) | 12.7% | 13.2% |
| Standard Deviation (Population) | 12.6% | 13.2% |
Demographics Similar to Immigrants from Scotland and Croatians by Wage/Income Gap
In terms of wage/income gap, the demographic groups most similar to Immigrants from Scotland are Maltese (28.7%, a difference of 0.050%), Lithuanian (28.7%, a difference of 0.060%), French (28.7%, a difference of 0.15%), Belgian (28.8%, a difference of 0.17%), and Basque (28.8%, a difference of 0.22%). Similarly, the demographic groups most similar to Croatians are Norwegian (29.0%, a difference of 0.12%), Hungarian (29.0%, a difference of 0.13%), Immigrants from Belgium (29.0%, a difference of 0.20%), Immigrants from Singapore (28.9%, a difference of 0.23%), and Welsh (28.9%, a difference of 0.25%).
| Demographics | Rating | Rank | Wage/Income Gap |
| Macedonians | 0.1 /100 | #309 | Tragic 28.6% |
| Finns | 0.1 /100 | #310 | Tragic 28.6% |
| Immigrants | Lithuania | 0.1 /100 | #311 | Tragic 28.6% |
| Eastern Europeans | 0.1 /100 | #312 | Tragic 28.6% |
| French | 0.1 /100 | #313 | Tragic 28.7% |
| Immigrants | Scotland | 0.1 /100 | #314 | Tragic 28.7% |
| Maltese | 0.1 /100 | #315 | Tragic 28.7% |
| Lithuanians | 0.1 /100 | #316 | Tragic 28.7% |
| Belgians | 0.1 /100 | #317 | Tragic 28.8% |
| Basques | 0.1 /100 | #318 | Tragic 28.8% |
| Slovaks | 0.1 /100 | #319 | Tragic 28.9% |
| British | 0.1 /100 | #320 | Tragic 28.9% |
| Welsh | 0.1 /100 | #321 | Tragic 28.9% |
| Immigrants | Singapore | 0.1 /100 | #322 | Tragic 28.9% |
| Norwegians | 0.1 /100 | #323 | Tragic 29.0% |
| Croatians | 0.0 /100 | #324 | Tragic 29.0% |
| Hungarians | 0.0 /100 | #325 | Tragic 29.0% |
| Immigrants | Belgium | 0.0 /100 | #326 | Tragic 29.0% |
| Immigrants | Iran | 0.0 /100 | #327 | Tragic 29.1% |
| Scandinavians | 0.0 /100 | #328 | Tragic 29.1% |
| Scottish | 0.0 /100 | #329 | Tragic 29.1% |