Croatian vs Immigrants from Northern Europe Wage/Income Gap
COMPARE
Croatian
Immigrants from Northern Europe
Wage/Income Gap
Wage/Income Gap Comparison
Croatians
Immigrants from Northern Europe
29.0%
WAGE/INCOME GAP
0.0/ 100
METRIC RATING
324th/ 347
METRIC RANK
28.5%
WAGE/INCOME GAP
0.2/ 100
METRIC RATING
300th/ 347
METRIC RANK
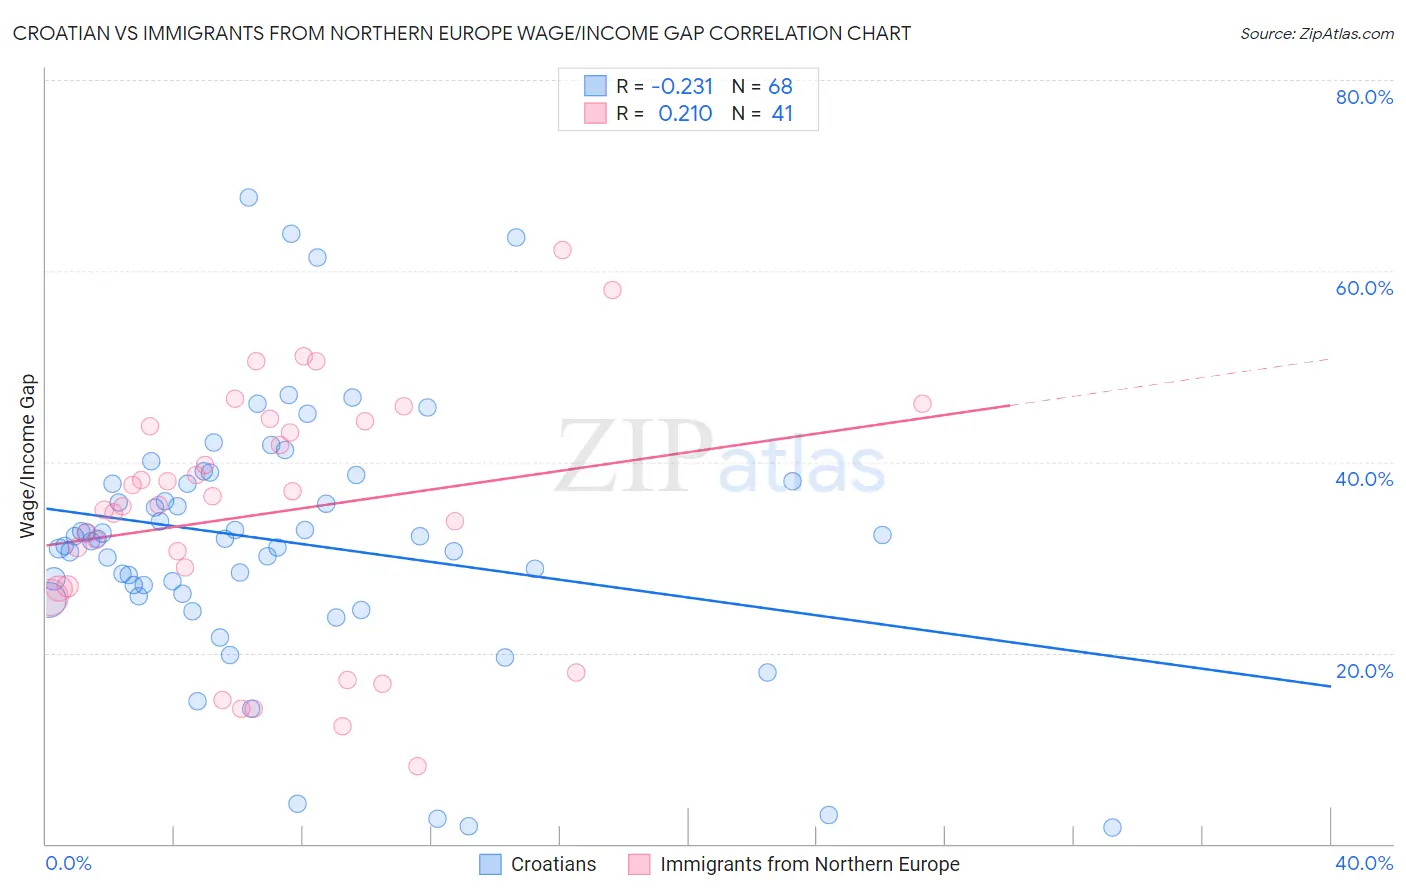
Croatian vs Immigrants from Northern Europe Wage/Income Gap Correlation Chart
The statistical analysis conducted on geographies consisting of 375,417,057 people shows a weak negative correlation between the proportion of Croatians and wage/income gap percentage in the United States with a correlation coefficient (R) of -0.231 and weighted average of 29.0%. Similarly, the statistical analysis conducted on geographies consisting of 476,427,799 people shows a weak positive correlation between the proportion of Immigrants from Northern Europe and wage/income gap percentage in the United States with a correlation coefficient (R) of 0.210 and weighted average of 28.5%, a difference of 1.9%.
Wage/Income Gap Correlation Summary
| Measurement | Croatian | Immigrants from Northern Europe |
| Minimum | 1.8% | 8.1% |
| Maximum | 67.7% | 62.1% |
| Range | 65.9% | 54.0% |
| Mean | 31.7% | 34.6% |
| Median | 31.9% | 35.4% |
| Interquartile 25% (IQ1) | 26.6% | 26.8% |
| Interquartile 75% (IQ3) | 37.8% | 44.0% |
| Interquartile Range (IQR) | 11.2% | 17.2% |
| Standard Deviation (Sample) | 13.2% | 12.8% |
| Standard Deviation (Population) | 13.2% | 12.6% |
Similar Demographics by Wage/Income Gap
Demographics Similar to Croatians by Wage/Income Gap
In terms of wage/income gap, the demographic groups most similar to Croatians are Norwegian (29.0%, a difference of 0.12%), Hungarian (29.0%, a difference of 0.13%), Immigrants from Belgium (29.0%, a difference of 0.20%), Immigrants from Singapore (28.9%, a difference of 0.23%), and Welsh (28.9%, a difference of 0.25%).
| Demographics | Rating | Rank | Wage/Income Gap |
| Belgians | 0.1 /100 | #317 | Tragic 28.8% |
| Basques | 0.1 /100 | #318 | Tragic 28.8% |
| Slovaks | 0.1 /100 | #319 | Tragic 28.9% |
| British | 0.1 /100 | #320 | Tragic 28.9% |
| Welsh | 0.1 /100 | #321 | Tragic 28.9% |
| Immigrants | Singapore | 0.1 /100 | #322 | Tragic 28.9% |
| Norwegians | 0.1 /100 | #323 | Tragic 29.0% |
| Croatians | 0.0 /100 | #324 | Tragic 29.0% |
| Hungarians | 0.0 /100 | #325 | Tragic 29.0% |
| Immigrants | Belgium | 0.0 /100 | #326 | Tragic 29.0% |
| Immigrants | Iran | 0.0 /100 | #327 | Tragic 29.1% |
| Scandinavians | 0.0 /100 | #328 | Tragic 29.1% |
| Scottish | 0.0 /100 | #329 | Tragic 29.1% |
| Germans | 0.0 /100 | #330 | Tragic 29.2% |
| Czechs | 0.0 /100 | #331 | Tragic 29.2% |
Demographics Similar to Immigrants from Northern Europe by Wage/Income Gap
In terms of wage/income gap, the demographic groups most similar to Immigrants from Northern Europe are Immigrants from Canada (28.5%, a difference of 0.040%), Scotch-Irish (28.5%, a difference of 0.070%), Irish (28.5%, a difference of 0.080%), Immigrants from North Macedonia (28.4%, a difference of 0.12%), and Austrian (28.4%, a difference of 0.16%).
| Demographics | Rating | Rank | Wage/Income Gap |
| Immigrants | Israel | 0.3 /100 | #293 | Tragic 28.2% |
| Greeks | 0.3 /100 | #294 | Tragic 28.2% |
| Slovenes | 0.3 /100 | #295 | Tragic 28.3% |
| Northern Europeans | 0.3 /100 | #296 | Tragic 28.3% |
| Immigrants | North America | 0.2 /100 | #297 | Tragic 28.4% |
| Austrians | 0.2 /100 | #298 | Tragic 28.4% |
| Immigrants | North Macedonia | 0.2 /100 | #299 | Tragic 28.4% |
| Immigrants | Northern Europe | 0.2 /100 | #300 | Tragic 28.5% |
| Immigrants | Canada | 0.2 /100 | #301 | Tragic 28.5% |
| Scotch-Irish | 0.2 /100 | #302 | Tragic 28.5% |
| Irish | 0.2 /100 | #303 | Tragic 28.5% |
| Immigrants | Netherlands | 0.2 /100 | #304 | Tragic 28.5% |
| Immigrants | South Africa | 0.1 /100 | #305 | Tragic 28.5% |
| Whites/Caucasians | 0.1 /100 | #306 | Tragic 28.5% |
| Immigrants | Denmark | 0.1 /100 | #307 | Tragic 28.5% |