Immigrants from Ghana vs Vietnamese Median Earnings
COMPARE
Immigrants from Ghana
Vietnamese
Median Earnings
Median Earnings Comparison
Immigrants from Ghana
Vietnamese
$45,641
MEDIAN EARNINGS
24.8/ 100
METRIC RATING
206th/ 347
METRIC RANK
$46,172
MEDIAN EARNINGS
40.9/ 100
METRIC RATING
186th/ 347
METRIC RANK
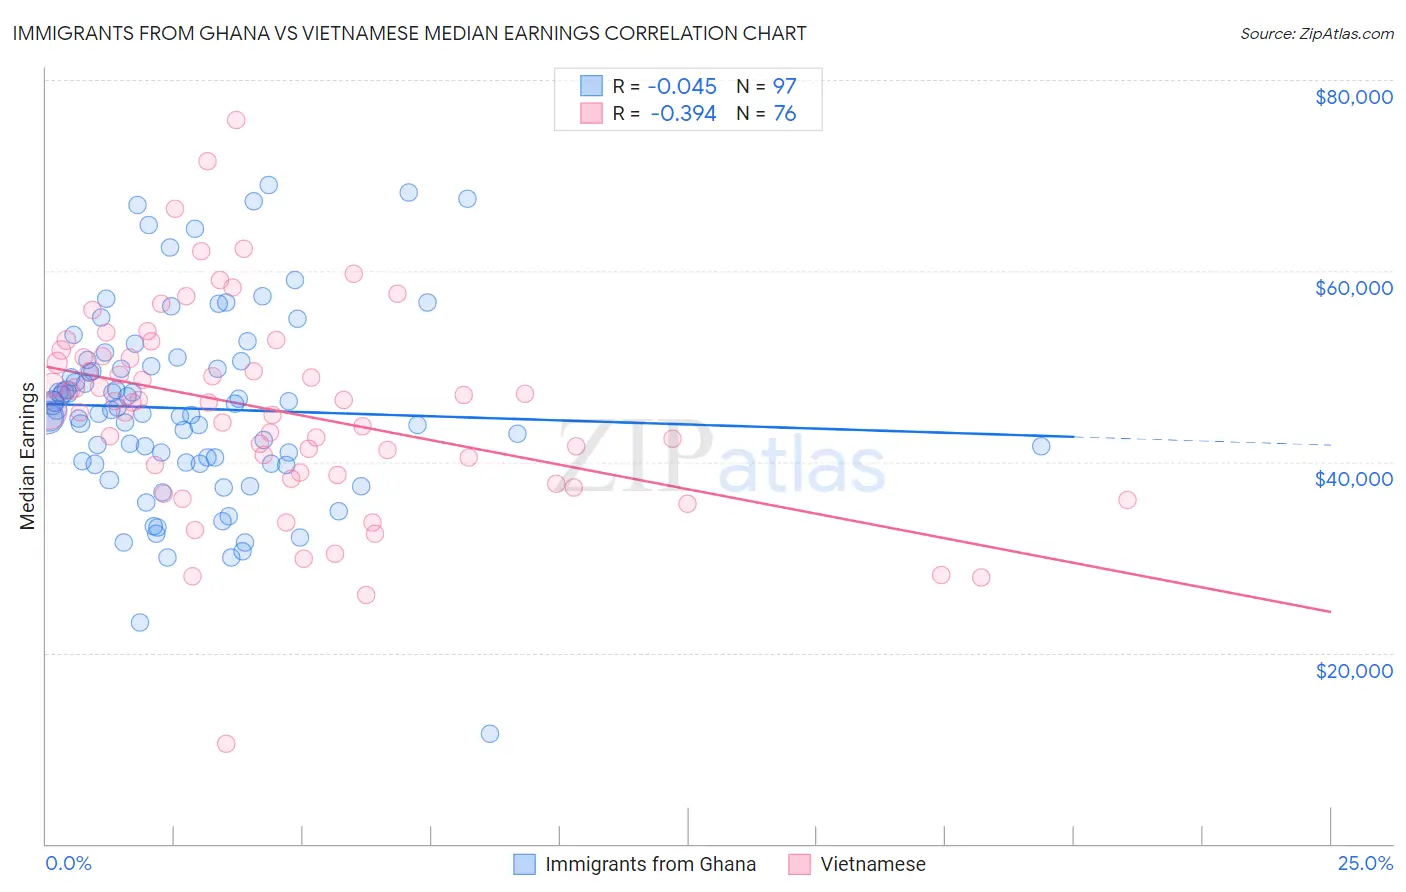
Immigrants from Ghana vs Vietnamese Median Earnings Correlation Chart
The statistical analysis conducted on geographies consisting of 199,945,483 people shows no correlation between the proportion of Immigrants from Ghana and median earnings in the United States with a correlation coefficient (R) of -0.045 and weighted average of $45,641. Similarly, the statistical analysis conducted on geographies consisting of 170,754,032 people shows a mild negative correlation between the proportion of Vietnamese and median earnings in the United States with a correlation coefficient (R) of -0.394 and weighted average of $46,172, a difference of 1.2%.
Median Earnings Correlation Summary
| Measurement | Immigrants from Ghana | Vietnamese |
| Minimum | $11,479 | $10,473 |
| Maximum | $69,009 | $75,862 |
| Range | $57,530 | $65,389 |
| Mean | $45,584 | $45,384 |
| Median | $45,406 | $46,190 |
| Interquartile 25% (IQ1) | $39,912 | $38,745 |
| Interquartile 75% (IQ3) | $50,257 | $50,994 |
| Interquartile Range (IQR) | $10,345 | $12,249 |
| Standard Deviation (Sample) | $10,012 | $10,718 |
| Standard Deviation (Population) | $9,960 | $10,647 |
Demographics Similar to Immigrants from Ghana and Vietnamese by Median Earnings
In terms of median earnings, the demographic groups most similar to Immigrants from Ghana are Tongan ($45,665, a difference of 0.050%), Immigrants from Uruguay ($45,682, a difference of 0.090%), Welsh ($45,710, a difference of 0.15%), Immigrants from Trinidad and Tobago ($45,729, a difference of 0.19%), and Celtic ($45,732, a difference of 0.20%). Similarly, the demographic groups most similar to Vietnamese are Iraqi ($46,140, a difference of 0.070%), Immigrants from Armenia ($46,094, a difference of 0.17%), Spaniard ($46,059, a difference of 0.24%), French Canadian ($46,026, a difference of 0.32%), and Finnish ($45,940, a difference of 0.50%).
| Demographics | Rating | Rank | Median Earnings |
| Vietnamese | 40.9 /100 | #186 | Average $46,172 |
| Iraqis | 39.9 /100 | #187 | Fair $46,140 |
| Immigrants | Armenia | 38.3 /100 | #188 | Fair $46,094 |
| Spaniards | 37.2 /100 | #189 | Fair $46,059 |
| French Canadians | 36.1 /100 | #190 | Fair $46,026 |
| Finns | 33.4 /100 | #191 | Fair $45,940 |
| Germans | 33.2 /100 | #192 | Fair $45,935 |
| Guamanians/Chamorros | 33.2 /100 | #193 | Fair $45,933 |
| Immigrants | Costa Rica | 33.0 /100 | #194 | Fair $45,928 |
| Immigrants | St. Vincent and the Grenadines | 32.4 /100 | #195 | Fair $45,908 |
| Yugoslavians | 30.5 /100 | #196 | Fair $45,846 |
| Barbadians | 30.5 /100 | #197 | Fair $45,846 |
| Trinidadians and Tobagonians | 29.7 /100 | #198 | Fair $45,820 |
| Immigrants | Barbados | 29.6 /100 | #199 | Fair $45,816 |
| Immigrants | Azores | 29.5 /100 | #200 | Fair $45,812 |
| Celtics | 27.2 /100 | #201 | Fair $45,732 |
| Immigrants | Trinidad and Tobago | 27.1 /100 | #202 | Fair $45,729 |
| Welsh | 26.6 /100 | #203 | Fair $45,710 |
| Immigrants | Uruguay | 25.9 /100 | #204 | Fair $45,682 |
| Tongans | 25.4 /100 | #205 | Fair $45,665 |
| Immigrants | Ghana | 24.8 /100 | #206 | Fair $45,641 |