Immigrants from Ghana vs Japanese Median Earnings
COMPARE
Immigrants from Ghana
Japanese
Median Earnings
Median Earnings Comparison
Immigrants from Ghana
Japanese
$45,641
MEDIAN EARNINGS
24.8/ 100
METRIC RATING
206th/ 347
METRIC RANK
$44,825
MEDIAN EARNINGS
9.5/ 100
METRIC RATING
231st/ 347
METRIC RANK
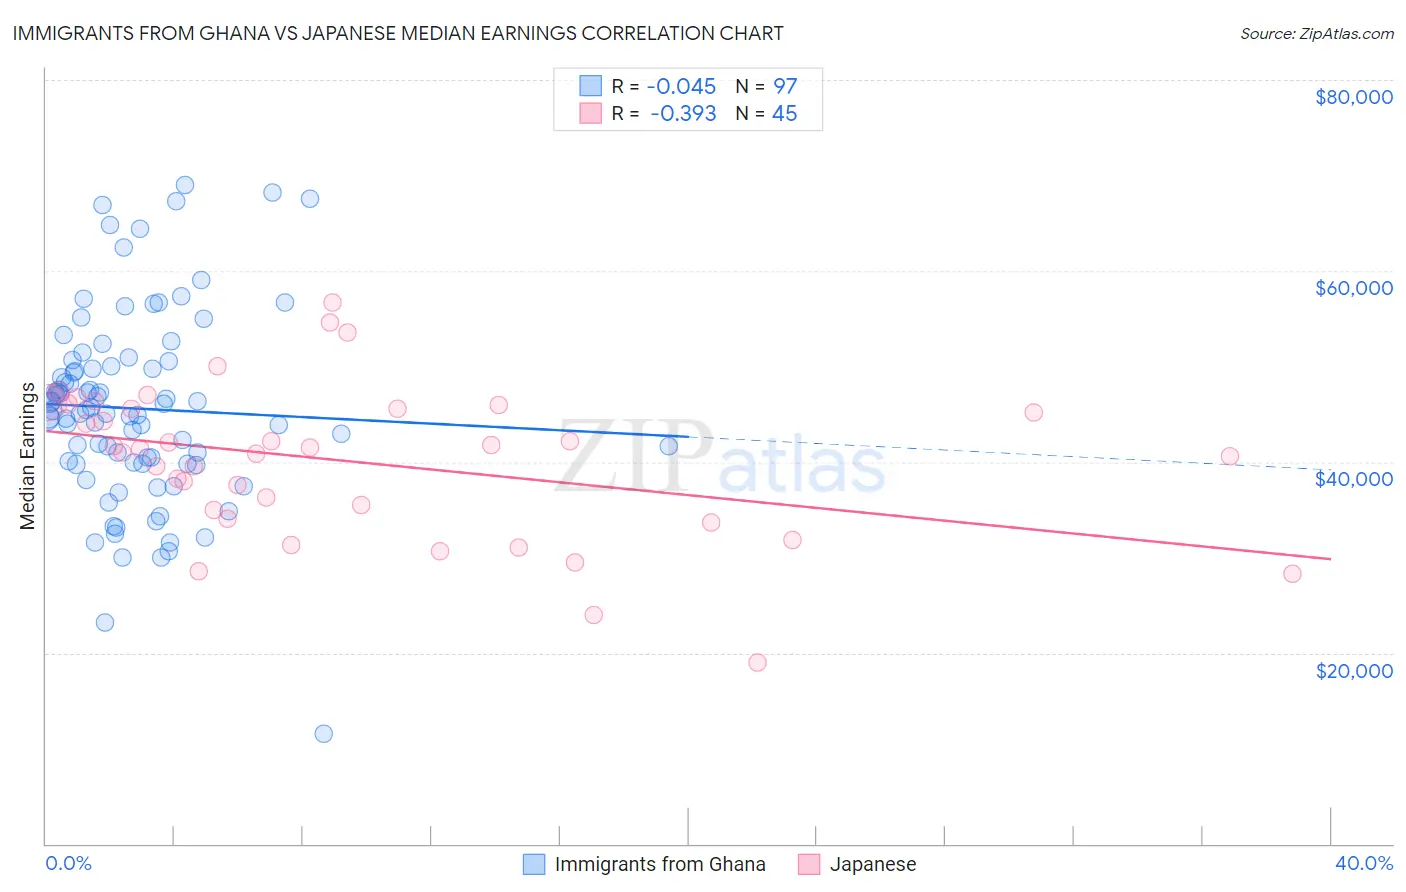
Immigrants from Ghana vs Japanese Median Earnings Correlation Chart
The statistical analysis conducted on geographies consisting of 199,945,483 people shows no correlation between the proportion of Immigrants from Ghana and median earnings in the United States with a correlation coefficient (R) of -0.045 and weighted average of $45,641. Similarly, the statistical analysis conducted on geographies consisting of 249,187,165 people shows a mild negative correlation between the proportion of Japanese and median earnings in the United States with a correlation coefficient (R) of -0.393 and weighted average of $44,825, a difference of 1.8%.
Median Earnings Correlation Summary
| Measurement | Immigrants from Ghana | Japanese |
| Minimum | $11,479 | $19,004 |
| Maximum | $69,009 | $56,680 |
| Range | $57,530 | $37,676 |
| Mean | $45,584 | $40,035 |
| Median | $45,406 | $41,417 |
| Interquartile 25% (IQ1) | $39,912 | $34,525 |
| Interquartile 75% (IQ3) | $50,257 | $45,796 |
| Interquartile Range (IQR) | $10,345 | $11,271 |
| Standard Deviation (Sample) | $10,012 | $7,916 |
| Standard Deviation (Population) | $9,960 | $7,827 |
Similar Demographics by Median Earnings
Demographics Similar to Immigrants from Ghana by Median Earnings
In terms of median earnings, the demographic groups most similar to Immigrants from Ghana are Tongan ($45,665, a difference of 0.050%), Immigrants from Senegal ($45,611, a difference of 0.070%), Immigrants from Uruguay ($45,682, a difference of 0.090%), Immigrants from Bosnia and Herzegovina ($45,600, a difference of 0.090%), and Immigrants from Thailand ($45,598, a difference of 0.10%).
| Demographics | Rating | Rank | Median Earnings |
| Immigrants | Barbados | 29.6 /100 | #199 | Fair $45,816 |
| Immigrants | Azores | 29.5 /100 | #200 | Fair $45,812 |
| Celtics | 27.2 /100 | #201 | Fair $45,732 |
| Immigrants | Trinidad and Tobago | 27.1 /100 | #202 | Fair $45,729 |
| Welsh | 26.6 /100 | #203 | Fair $45,710 |
| Immigrants | Uruguay | 25.9 /100 | #204 | Fair $45,682 |
| Tongans | 25.4 /100 | #205 | Fair $45,665 |
| Immigrants | Ghana | 24.8 /100 | #206 | Fair $45,641 |
| Immigrants | Senegal | 24.0 /100 | #207 | Fair $45,611 |
| Immigrants | Bosnia and Herzegovina | 23.7 /100 | #208 | Fair $45,600 |
| Immigrants | Thailand | 23.7 /100 | #209 | Fair $45,598 |
| Immigrants | Grenada | 23.6 /100 | #210 | Fair $45,596 |
| Panamanians | 23.5 /100 | #211 | Fair $45,593 |
| Bermudans | 23.5 /100 | #212 | Fair $45,593 |
| Immigrants | Colombia | 22.4 /100 | #213 | Fair $45,550 |
Demographics Similar to Japanese by Median Earnings
In terms of median earnings, the demographic groups most similar to Japanese are Delaware ($44,783, a difference of 0.090%), Immigrants from Sudan ($44,767, a difference of 0.13%), Immigrants from Western Africa ($44,893, a difference of 0.15%), Scotch-Irish ($44,924, a difference of 0.22%), and Immigrants from Iraq ($44,988, a difference of 0.37%).
| Demographics | Rating | Rank | Median Earnings |
| West Indians | 13.9 /100 | #224 | Poor $45,132 |
| Immigrants | Cambodia | 13.2 /100 | #225 | Poor $45,090 |
| Immigrants | Nigeria | 12.2 /100 | #226 | Poor $45,030 |
| Native Hawaiians | 12.2 /100 | #227 | Poor $45,027 |
| Immigrants | Iraq | 11.6 /100 | #228 | Poor $44,988 |
| Scotch-Irish | 10.7 /100 | #229 | Poor $44,924 |
| Immigrants | Western Africa | 10.3 /100 | #230 | Poor $44,893 |
| Japanese | 9.5 /100 | #231 | Tragic $44,825 |
| Delaware | 9.0 /100 | #232 | Tragic $44,783 |
| Immigrants | Sudan | 8.8 /100 | #233 | Tragic $44,767 |
| Cape Verdeans | 7.5 /100 | #234 | Tragic $44,640 |
| Venezuelans | 6.9 /100 | #235 | Tragic $44,580 |
| British West Indians | 6.7 /100 | #236 | Tragic $44,552 |
| Immigrants | Ecuador | 5.9 /100 | #237 | Tragic $44,462 |
| Sudanese | 5.6 /100 | #238 | Tragic $44,419 |