Immigrants from Ghana vs Malaysian Median Earnings
COMPARE
Immigrants from Ghana
Malaysian
Median Earnings
Median Earnings Comparison
Immigrants from Ghana
Malaysians
$45,641
MEDIAN EARNINGS
24.8/ 100
METRIC RATING
206th/ 347
METRIC RANK
$43,844
MEDIAN EARNINGS
2.6/ 100
METRIC RATING
249th/ 347
METRIC RANK
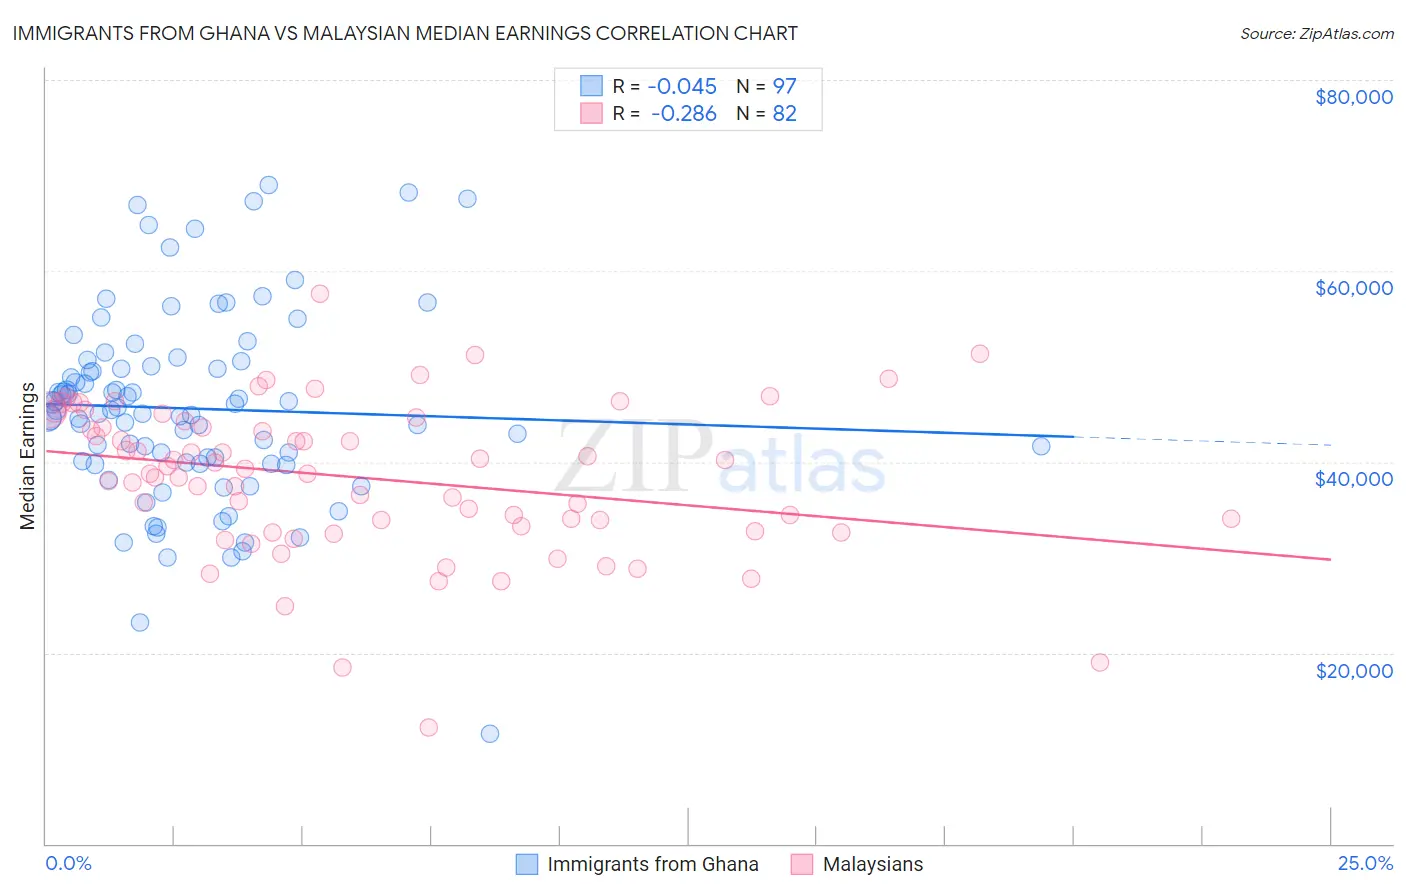
Immigrants from Ghana vs Malaysian Median Earnings Correlation Chart
The statistical analysis conducted on geographies consisting of 199,945,483 people shows no correlation between the proportion of Immigrants from Ghana and median earnings in the United States with a correlation coefficient (R) of -0.045 and weighted average of $45,641. Similarly, the statistical analysis conducted on geographies consisting of 226,109,286 people shows a weak negative correlation between the proportion of Malaysians and median earnings in the United States with a correlation coefficient (R) of -0.286 and weighted average of $43,844, a difference of 4.1%.
Median Earnings Correlation Summary
| Measurement | Immigrants from Ghana | Malaysian |
| Minimum | $11,479 | $12,196 |
| Maximum | $69,009 | $57,662 |
| Range | $57,530 | $45,466 |
| Mean | $45,584 | $38,334 |
| Median | $45,406 | $39,047 |
| Interquartile 25% (IQ1) | $39,912 | $33,295 |
| Interquartile 75% (IQ3) | $50,257 | $44,277 |
| Interquartile Range (IQR) | $10,345 | $10,982 |
| Standard Deviation (Sample) | $10,012 | $7,931 |
| Standard Deviation (Population) | $9,960 | $7,883 |
Similar Demographics by Median Earnings
Demographics Similar to Immigrants from Ghana by Median Earnings
In terms of median earnings, the demographic groups most similar to Immigrants from Ghana are Tongan ($45,665, a difference of 0.050%), Immigrants from Senegal ($45,611, a difference of 0.070%), Immigrants from Uruguay ($45,682, a difference of 0.090%), Immigrants from Bosnia and Herzegovina ($45,600, a difference of 0.090%), and Immigrants from Thailand ($45,598, a difference of 0.10%).
| Demographics | Rating | Rank | Median Earnings |
| Immigrants | Barbados | 29.6 /100 | #199 | Fair $45,816 |
| Immigrants | Azores | 29.5 /100 | #200 | Fair $45,812 |
| Celtics | 27.2 /100 | #201 | Fair $45,732 |
| Immigrants | Trinidad and Tobago | 27.1 /100 | #202 | Fair $45,729 |
| Welsh | 26.6 /100 | #203 | Fair $45,710 |
| Immigrants | Uruguay | 25.9 /100 | #204 | Fair $45,682 |
| Tongans | 25.4 /100 | #205 | Fair $45,665 |
| Immigrants | Ghana | 24.8 /100 | #206 | Fair $45,641 |
| Immigrants | Senegal | 24.0 /100 | #207 | Fair $45,611 |
| Immigrants | Bosnia and Herzegovina | 23.7 /100 | #208 | Fair $45,600 |
| Immigrants | Thailand | 23.7 /100 | #209 | Fair $45,598 |
| Immigrants | Grenada | 23.6 /100 | #210 | Fair $45,596 |
| Panamanians | 23.5 /100 | #211 | Fair $45,593 |
| Bermudans | 23.5 /100 | #212 | Fair $45,593 |
| Immigrants | Colombia | 22.4 /100 | #213 | Fair $45,550 |
Demographics Similar to Malaysians by Median Earnings
In terms of median earnings, the demographic groups most similar to Malaysians are Nepalese ($43,860, a difference of 0.040%), Alaska Native ($43,750, a difference of 0.22%), Immigrants from Cabo Verde ($43,963, a difference of 0.27%), Immigrants from West Indies ($43,989, a difference of 0.33%), and Tsimshian ($43,695, a difference of 0.34%).
| Demographics | Rating | Rank | Median Earnings |
| Immigrants | Venezuela | 4.0 /100 | #242 | Tragic $44,163 |
| Sub-Saharan Africans | 3.7 /100 | #243 | Tragic $44,118 |
| Immigrants | Nonimmigrants | 3.7 /100 | #244 | Tragic $44,117 |
| Immigrants | Burma/Myanmar | 3.2 /100 | #245 | Tragic $43,998 |
| Immigrants | West Indies | 3.1 /100 | #246 | Tragic $43,989 |
| Immigrants | Cabo Verde | 3.0 /100 | #247 | Tragic $43,963 |
| Nepalese | 2.6 /100 | #248 | Tragic $43,860 |
| Malaysians | 2.6 /100 | #249 | Tragic $43,844 |
| Alaska Natives | 2.3 /100 | #250 | Tragic $43,750 |
| Tsimshian | 2.1 /100 | #251 | Tragic $43,695 |
| Hawaiians | 2.0 /100 | #252 | Tragic $43,673 |
| Somalis | 1.8 /100 | #253 | Tragic $43,567 |
| Liberians | 1.7 /100 | #254 | Tragic $43,536 |
| Immigrants | Middle Africa | 1.4 /100 | #255 | Tragic $43,416 |
| Alaskan Athabascans | 1.4 /100 | #256 | Tragic $43,393 |