Immigrants from Ghana vs Afghan Median Earnings
COMPARE
Immigrants from Ghana
Afghan
Median Earnings
Median Earnings Comparison
Immigrants from Ghana
Afghans
$45,641
MEDIAN EARNINGS
24.8/ 100
METRIC RATING
206th/ 347
METRIC RANK
$51,112
MEDIAN EARNINGS
99.9/ 100
METRIC RATING
66th/ 347
METRIC RANK
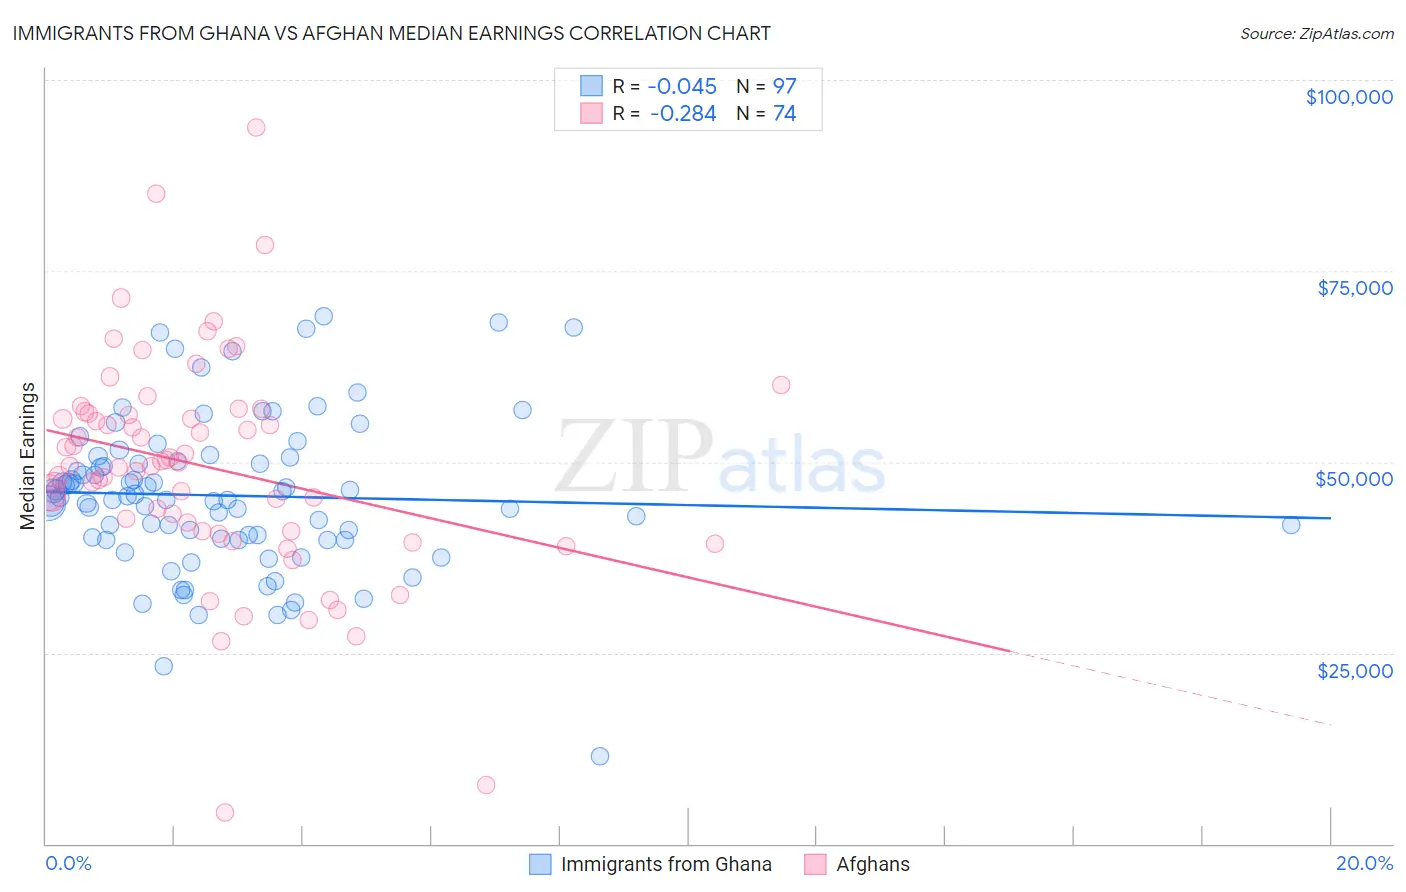
Immigrants from Ghana vs Afghan Median Earnings Correlation Chart
The statistical analysis conducted on geographies consisting of 199,945,483 people shows no correlation between the proportion of Immigrants from Ghana and median earnings in the United States with a correlation coefficient (R) of -0.045 and weighted average of $45,641. Similarly, the statistical analysis conducted on geographies consisting of 148,874,377 people shows a weak negative correlation between the proportion of Afghans and median earnings in the United States with a correlation coefficient (R) of -0.284 and weighted average of $51,112, a difference of 12.0%.
Median Earnings Correlation Summary
| Measurement | Immigrants from Ghana | Afghan |
| Minimum | $11,479 | $4,034 |
| Maximum | $69,009 | $93,750 |
| Range | $57,530 | $89,716 |
| Mean | $45,584 | $49,335 |
| Median | $45,406 | $49,670 |
| Interquartile 25% (IQ1) | $39,912 | $40,877 |
| Interquartile 75% (IQ3) | $50,257 | $56,283 |
| Interquartile Range (IQR) | $10,345 | $15,406 |
| Standard Deviation (Sample) | $10,012 | $14,513 |
| Standard Deviation (Population) | $9,960 | $14,415 |
Similar Demographics by Median Earnings
Demographics Similar to Immigrants from Ghana by Median Earnings
In terms of median earnings, the demographic groups most similar to Immigrants from Ghana are Tongan ($45,665, a difference of 0.050%), Immigrants from Senegal ($45,611, a difference of 0.070%), Immigrants from Uruguay ($45,682, a difference of 0.090%), Immigrants from Bosnia and Herzegovina ($45,600, a difference of 0.090%), and Immigrants from Thailand ($45,598, a difference of 0.10%).
| Demographics | Rating | Rank | Median Earnings |
| Immigrants | Barbados | 29.6 /100 | #199 | Fair $45,816 |
| Immigrants | Azores | 29.5 /100 | #200 | Fair $45,812 |
| Celtics | 27.2 /100 | #201 | Fair $45,732 |
| Immigrants | Trinidad and Tobago | 27.1 /100 | #202 | Fair $45,729 |
| Welsh | 26.6 /100 | #203 | Fair $45,710 |
| Immigrants | Uruguay | 25.9 /100 | #204 | Fair $45,682 |
| Tongans | 25.4 /100 | #205 | Fair $45,665 |
| Immigrants | Ghana | 24.8 /100 | #206 | Fair $45,641 |
| Immigrants | Senegal | 24.0 /100 | #207 | Fair $45,611 |
| Immigrants | Bosnia and Herzegovina | 23.7 /100 | #208 | Fair $45,600 |
| Immigrants | Thailand | 23.7 /100 | #209 | Fair $45,598 |
| Immigrants | Grenada | 23.6 /100 | #210 | Fair $45,596 |
| Panamanians | 23.5 /100 | #211 | Fair $45,593 |
| Bermudans | 23.5 /100 | #212 | Fair $45,593 |
| Immigrants | Colombia | 22.4 /100 | #213 | Fair $45,550 |
Demographics Similar to Afghans by Median Earnings
In terms of median earnings, the demographic groups most similar to Afghans are Immigrants from Spain ($51,092, a difference of 0.040%), Paraguayan ($51,068, a difference of 0.090%), Greek ($51,164, a difference of 0.10%), Mongolian ($51,038, a difference of 0.15%), and Lithuanian ($50,991, a difference of 0.24%).
| Demographics | Rating | Rank | Median Earnings |
| Immigrants | Croatia | 99.9 /100 | #59 | Exceptional $51,581 |
| Immigrants | Serbia | 99.9 /100 | #60 | Exceptional $51,557 |
| Immigrants | Latvia | 99.9 /100 | #61 | Exceptional $51,555 |
| Immigrants | Romania | 99.9 /100 | #62 | Exceptional $51,337 |
| Immigrants | Bulgaria | 99.9 /100 | #63 | Exceptional $51,318 |
| New Zealanders | 99.9 /100 | #64 | Exceptional $51,246 |
| Greeks | 99.9 /100 | #65 | Exceptional $51,164 |
| Afghans | 99.9 /100 | #66 | Exceptional $51,112 |
| Immigrants | Spain | 99.9 /100 | #67 | Exceptional $51,092 |
| Paraguayans | 99.9 /100 | #68 | Exceptional $51,068 |
| Mongolians | 99.8 /100 | #69 | Exceptional $51,038 |
| Lithuanians | 99.8 /100 | #70 | Exceptional $50,991 |
| Immigrants | Ukraine | 99.8 /100 | #71 | Exceptional $50,984 |
| Immigrants | Egypt | 99.8 /100 | #72 | Exceptional $50,901 |
| Immigrants | Netherlands | 99.8 /100 | #73 | Exceptional $50,818 |