Immigrants from Romania vs Vietnamese Median Earnings
COMPARE
Immigrants from Romania
Vietnamese
Median Earnings
Median Earnings Comparison
Immigrants from Romania
Vietnamese
$51,337
MEDIAN EARNINGS
99.9/ 100
METRIC RATING
62nd/ 347
METRIC RANK
$46,172
MEDIAN EARNINGS
40.9/ 100
METRIC RATING
186th/ 347
METRIC RANK
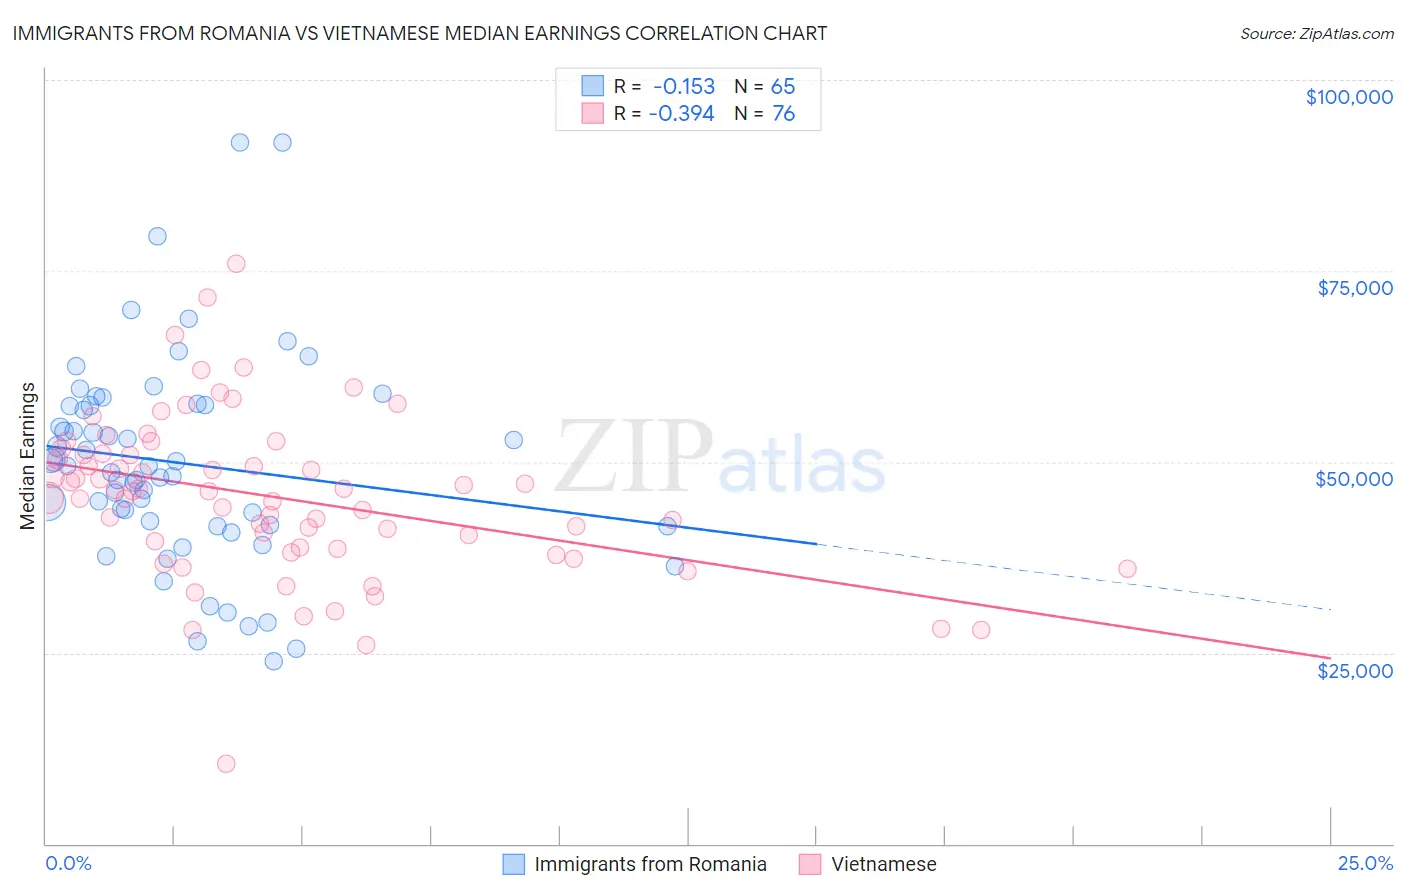
Immigrants from Romania vs Vietnamese Median Earnings Correlation Chart
The statistical analysis conducted on geographies consisting of 257,003,110 people shows a poor negative correlation between the proportion of Immigrants from Romania and median earnings in the United States with a correlation coefficient (R) of -0.153 and weighted average of $51,337. Similarly, the statistical analysis conducted on geographies consisting of 170,754,032 people shows a mild negative correlation between the proportion of Vietnamese and median earnings in the United States with a correlation coefficient (R) of -0.394 and weighted average of $46,172, a difference of 11.2%.
Median Earnings Correlation Summary
| Measurement | Immigrants from Romania | Vietnamese |
| Minimum | $23,864 | $10,473 |
| Maximum | $91,786 | $75,862 |
| Range | $67,922 | $65,389 |
| Mean | $49,856 | $45,384 |
| Median | $49,415 | $46,190 |
| Interquartile 25% (IQ1) | $41,640 | $38,745 |
| Interquartile 75% (IQ3) | $57,433 | $50,994 |
| Interquartile Range (IQR) | $15,793 | $12,249 |
| Standard Deviation (Sample) | $13,572 | $10,718 |
| Standard Deviation (Population) | $13,467 | $10,647 |
Similar Demographics by Median Earnings
Demographics Similar to Immigrants from Romania by Median Earnings
In terms of median earnings, the demographic groups most similar to Immigrants from Romania are Immigrants from Bulgaria ($51,318, a difference of 0.040%), New Zealander ($51,246, a difference of 0.18%), Greek ($51,164, a difference of 0.34%), Immigrants from Latvia ($51,555, a difference of 0.42%), and Immigrants from Serbia ($51,557, a difference of 0.43%).
| Demographics | Rating | Rank | Median Earnings |
| Egyptians | 99.9 /100 | #55 | Exceptional $51,701 |
| Immigrants | Pakistan | 99.9 /100 | #56 | Exceptional $51,693 |
| Immigrants | Eastern Europe | 99.9 /100 | #57 | Exceptional $51,624 |
| Immigrants | Bolivia | 99.9 /100 | #58 | Exceptional $51,605 |
| Immigrants | Croatia | 99.9 /100 | #59 | Exceptional $51,581 |
| Immigrants | Serbia | 99.9 /100 | #60 | Exceptional $51,557 |
| Immigrants | Latvia | 99.9 /100 | #61 | Exceptional $51,555 |
| Immigrants | Romania | 99.9 /100 | #62 | Exceptional $51,337 |
| Immigrants | Bulgaria | 99.9 /100 | #63 | Exceptional $51,318 |
| New Zealanders | 99.9 /100 | #64 | Exceptional $51,246 |
| Greeks | 99.9 /100 | #65 | Exceptional $51,164 |
| Afghans | 99.9 /100 | #66 | Exceptional $51,112 |
| Immigrants | Spain | 99.9 /100 | #67 | Exceptional $51,092 |
| Paraguayans | 99.9 /100 | #68 | Exceptional $51,068 |
| Mongolians | 99.8 /100 | #69 | Exceptional $51,038 |
Demographics Similar to Vietnamese by Median Earnings
In terms of median earnings, the demographic groups most similar to Vietnamese are Uruguayan ($46,190, a difference of 0.040%), Iraqi ($46,140, a difference of 0.070%), Immigrants from Kenya ($46,214, a difference of 0.090%), Immigrants from Armenia ($46,094, a difference of 0.17%), and Spaniard ($46,059, a difference of 0.24%).
| Demographics | Rating | Rank | Median Earnings |
| English | 46.5 /100 | #179 | Average $46,334 |
| Puget Sound Salish | 46.5 /100 | #180 | Average $46,333 |
| Immigrants | Cameroon | 46.4 /100 | #181 | Average $46,329 |
| Swiss | 45.9 /100 | #182 | Average $46,315 |
| French | 45.2 /100 | #183 | Average $46,296 |
| Immigrants | Kenya | 42.4 /100 | #184 | Average $46,214 |
| Uruguayans | 41.6 /100 | #185 | Average $46,190 |
| Vietnamese | 40.9 /100 | #186 | Average $46,172 |
| Iraqis | 39.9 /100 | #187 | Fair $46,140 |
| Immigrants | Armenia | 38.3 /100 | #188 | Fair $46,094 |
| Spaniards | 37.2 /100 | #189 | Fair $46,059 |
| French Canadians | 36.1 /100 | #190 | Fair $46,026 |
| Finns | 33.4 /100 | #191 | Fair $45,940 |
| Germans | 33.2 /100 | #192 | Fair $45,935 |
| Guamanians/Chamorros | 33.2 /100 | #193 | Fair $45,933 |