Jordanian vs Vietnamese Median Earnings
COMPARE
Jordanian
Vietnamese
Median Earnings
Median Earnings Comparison
Jordanians
Vietnamese
$49,632
MEDIAN EARNINGS
98.9/ 100
METRIC RATING
101st/ 347
METRIC RANK
$46,172
MEDIAN EARNINGS
40.9/ 100
METRIC RATING
186th/ 347
METRIC RANK
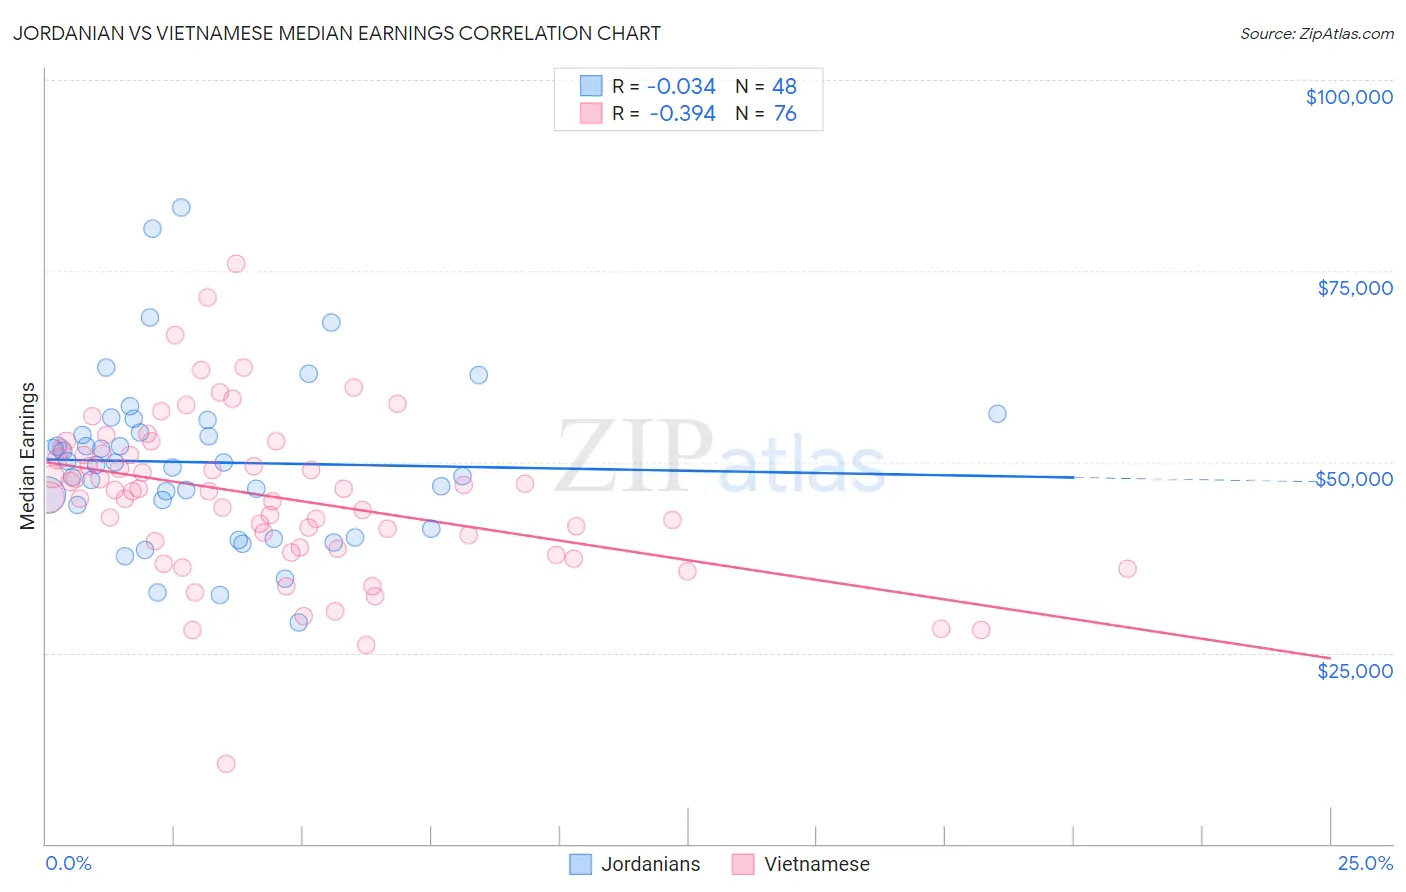
Jordanian vs Vietnamese Median Earnings Correlation Chart
The statistical analysis conducted on geographies consisting of 166,400,944 people shows no correlation between the proportion of Jordanians and median earnings in the United States with a correlation coefficient (R) of -0.034 and weighted average of $49,632. Similarly, the statistical analysis conducted on geographies consisting of 170,754,032 people shows a mild negative correlation between the proportion of Vietnamese and median earnings in the United States with a correlation coefficient (R) of -0.394 and weighted average of $46,172, a difference of 7.5%.
Median Earnings Correlation Summary
| Measurement | Jordanian | Vietnamese |
| Minimum | $29,018 | $10,473 |
| Maximum | $83,283 | $75,862 |
| Range | $54,265 | $65,389 |
| Mean | $49,942 | $45,384 |
| Median | $49,819 | $46,190 |
| Interquartile 25% (IQ1) | $42,798 | $38,745 |
| Interquartile 75% (IQ3) | $54,622 | $50,994 |
| Interquartile Range (IQR) | $11,824 | $12,249 |
| Standard Deviation (Sample) | $11,002 | $10,718 |
| Standard Deviation (Population) | $10,887 | $10,647 |
Similar Demographics by Median Earnings
Demographics Similar to Jordanians by Median Earnings
In terms of median earnings, the demographic groups most similar to Jordanians are Immigrants from Poland ($49,633, a difference of 0.0%), Immigrants from Northern Africa ($49,648, a difference of 0.030%), Immigrants from Afghanistan ($49,645, a difference of 0.030%), Immigrants from North Macedonia ($49,658, a difference of 0.050%), and Immigrants from Lebanon ($49,682, a difference of 0.10%).
| Demographics | Rating | Rank | Median Earnings |
| Croatians | 99.0 /100 | #94 | Exceptional $49,724 |
| Immigrants | England | 99.0 /100 | #95 | Exceptional $49,722 |
| Immigrants | Lebanon | 99.0 /100 | #96 | Exceptional $49,682 |
| Immigrants | North Macedonia | 98.9 /100 | #97 | Exceptional $49,658 |
| Immigrants | Northern Africa | 98.9 /100 | #98 | Exceptional $49,648 |
| Immigrants | Afghanistan | 98.9 /100 | #99 | Exceptional $49,645 |
| Immigrants | Poland | 98.9 /100 | #100 | Exceptional $49,633 |
| Jordanians | 98.9 /100 | #101 | Exceptional $49,632 |
| Ethiopians | 98.8 /100 | #102 | Exceptional $49,572 |
| Austrians | 98.7 /100 | #103 | Exceptional $49,501 |
| Immigrants | Brazil | 98.6 /100 | #104 | Exceptional $49,463 |
| Immigrants | Western Asia | 98.4 /100 | #105 | Exceptional $49,389 |
| Immigrants | Albania | 98.4 /100 | #106 | Exceptional $49,377 |
| Immigrants | Morocco | 98.4 /100 | #107 | Exceptional $49,368 |
| Palestinians | 98.0 /100 | #108 | Exceptional $49,209 |
Demographics Similar to Vietnamese by Median Earnings
In terms of median earnings, the demographic groups most similar to Vietnamese are Uruguayan ($46,190, a difference of 0.040%), Iraqi ($46,140, a difference of 0.070%), Immigrants from Kenya ($46,214, a difference of 0.090%), Immigrants from Armenia ($46,094, a difference of 0.17%), and Spaniard ($46,059, a difference of 0.24%).
| Demographics | Rating | Rank | Median Earnings |
| English | 46.5 /100 | #179 | Average $46,334 |
| Puget Sound Salish | 46.5 /100 | #180 | Average $46,333 |
| Immigrants | Cameroon | 46.4 /100 | #181 | Average $46,329 |
| Swiss | 45.9 /100 | #182 | Average $46,315 |
| French | 45.2 /100 | #183 | Average $46,296 |
| Immigrants | Kenya | 42.4 /100 | #184 | Average $46,214 |
| Uruguayans | 41.6 /100 | #185 | Average $46,190 |
| Vietnamese | 40.9 /100 | #186 | Average $46,172 |
| Iraqis | 39.9 /100 | #187 | Fair $46,140 |
| Immigrants | Armenia | 38.3 /100 | #188 | Fair $46,094 |
| Spaniards | 37.2 /100 | #189 | Fair $46,059 |
| French Canadians | 36.1 /100 | #190 | Fair $46,026 |
| Finns | 33.4 /100 | #191 | Fair $45,940 |
| Germans | 33.2 /100 | #192 | Fair $45,935 |
| Guamanians/Chamorros | 33.2 /100 | #193 | Fair $45,933 |