Central American Indian vs Vietnamese Median Earnings
COMPARE
Central American Indian
Vietnamese
Median Earnings
Median Earnings Comparison
Central American Indians
Vietnamese
$41,474
MEDIAN EARNINGS
0.1/ 100
METRIC RATING
291st/ 347
METRIC RANK
$46,172
MEDIAN EARNINGS
40.9/ 100
METRIC RATING
186th/ 347
METRIC RANK
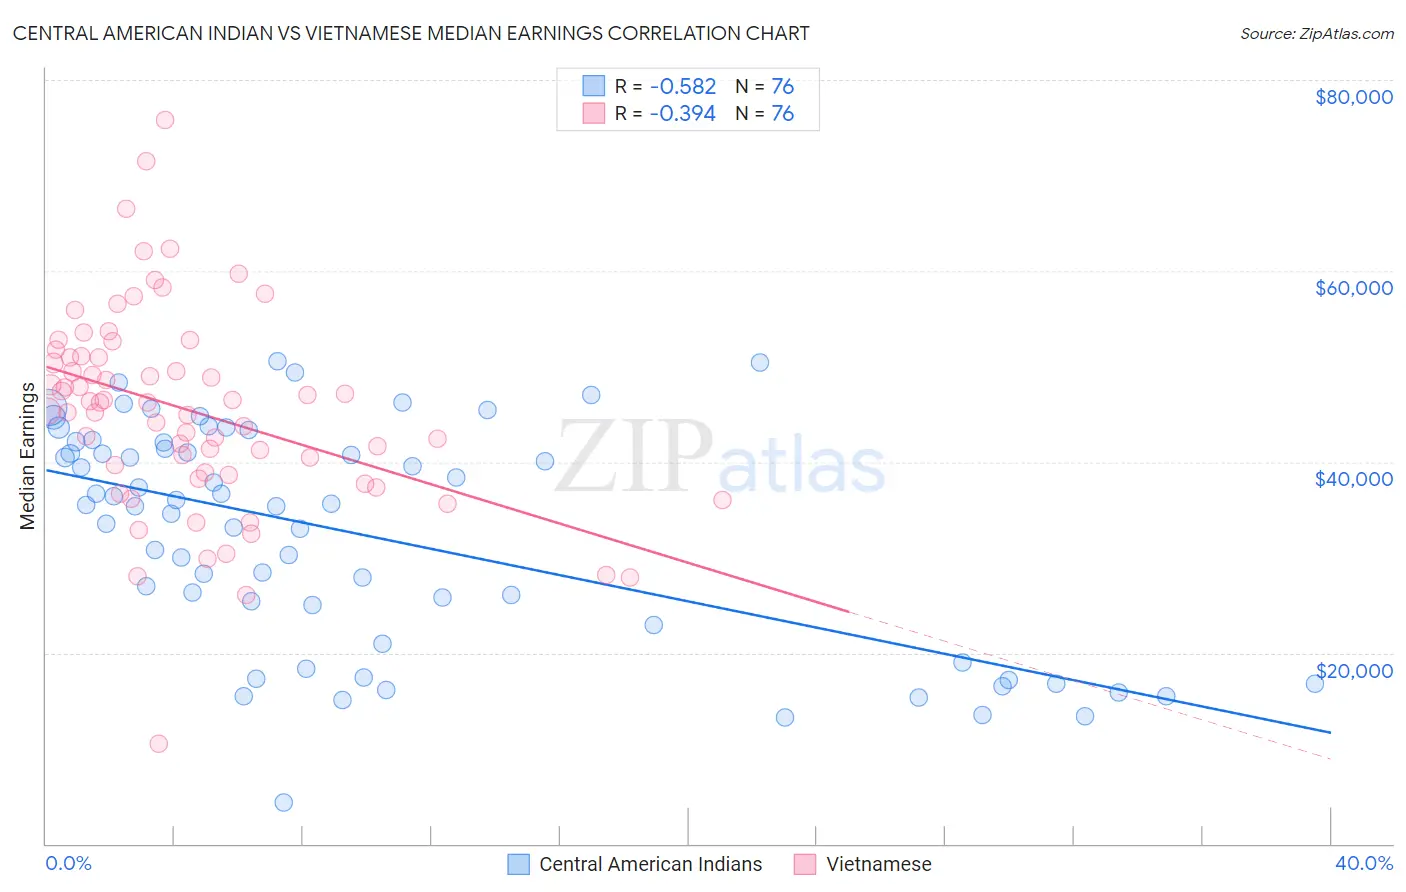
Central American Indian vs Vietnamese Median Earnings Correlation Chart
The statistical analysis conducted on geographies consisting of 326,124,728 people shows a substantial negative correlation between the proportion of Central American Indians and median earnings in the United States with a correlation coefficient (R) of -0.582 and weighted average of $41,474. Similarly, the statistical analysis conducted on geographies consisting of 170,754,032 people shows a mild negative correlation between the proportion of Vietnamese and median earnings in the United States with a correlation coefficient (R) of -0.394 and weighted average of $46,172, a difference of 11.3%.
Median Earnings Correlation Summary
| Measurement | Central American Indian | Vietnamese |
| Minimum | $4,300 | $10,473 |
| Maximum | $50,550 | $75,862 |
| Range | $46,250 | $65,389 |
| Mean | $32,321 | $45,384 |
| Median | $35,426 | $46,190 |
| Interquartile 25% (IQ1) | $21,944 | $38,745 |
| Interquartile 75% (IQ3) | $41,662 | $50,994 |
| Interquartile Range (IQR) | $19,717 | $12,249 |
| Standard Deviation (Sample) | $11,652 | $10,718 |
| Standard Deviation (Population) | $11,575 | $10,647 |
Similar Demographics by Median Earnings
Demographics Similar to Central American Indians by Median Earnings
In terms of median earnings, the demographic groups most similar to Central American Indians are U.S. Virgin Islander ($41,448, a difference of 0.060%), Paiute ($41,508, a difference of 0.080%), Comanche ($41,519, a difference of 0.11%), Immigrants from Dominican Republic ($41,554, a difference of 0.19%), and Immigrants from Zaire ($41,325, a difference of 0.36%).
| Demographics | Rating | Rank | Median Earnings |
| Blackfeet | 0.2 /100 | #284 | Tragic $41,822 |
| Immigrants | Nicaragua | 0.1 /100 | #285 | Tragic $41,737 |
| Mexican American Indians | 0.1 /100 | #286 | Tragic $41,719 |
| Indonesians | 0.1 /100 | #287 | Tragic $41,701 |
| Immigrants | Dominican Republic | 0.1 /100 | #288 | Tragic $41,554 |
| Comanche | 0.1 /100 | #289 | Tragic $41,519 |
| Paiute | 0.1 /100 | #290 | Tragic $41,508 |
| Central American Indians | 0.1 /100 | #291 | Tragic $41,474 |
| U.S. Virgin Islanders | 0.1 /100 | #292 | Tragic $41,448 |
| Immigrants | Zaire | 0.1 /100 | #293 | Tragic $41,325 |
| Potawatomi | 0.1 /100 | #294 | Tragic $41,288 |
| Bangladeshis | 0.1 /100 | #295 | Tragic $41,263 |
| Cherokee | 0.1 /100 | #296 | Tragic $41,252 |
| Guatemalans | 0.1 /100 | #297 | Tragic $41,205 |
| Immigrants | Micronesia | 0.1 /100 | #298 | Tragic $41,133 |
Demographics Similar to Vietnamese by Median Earnings
In terms of median earnings, the demographic groups most similar to Vietnamese are Uruguayan ($46,190, a difference of 0.040%), Iraqi ($46,140, a difference of 0.070%), Immigrants from Kenya ($46,214, a difference of 0.090%), Immigrants from Armenia ($46,094, a difference of 0.17%), and Spaniard ($46,059, a difference of 0.24%).
| Demographics | Rating | Rank | Median Earnings |
| English | 46.5 /100 | #179 | Average $46,334 |
| Puget Sound Salish | 46.5 /100 | #180 | Average $46,333 |
| Immigrants | Cameroon | 46.4 /100 | #181 | Average $46,329 |
| Swiss | 45.9 /100 | #182 | Average $46,315 |
| French | 45.2 /100 | #183 | Average $46,296 |
| Immigrants | Kenya | 42.4 /100 | #184 | Average $46,214 |
| Uruguayans | 41.6 /100 | #185 | Average $46,190 |
| Vietnamese | 40.9 /100 | #186 | Average $46,172 |
| Iraqis | 39.9 /100 | #187 | Fair $46,140 |
| Immigrants | Armenia | 38.3 /100 | #188 | Fair $46,094 |
| Spaniards | 37.2 /100 | #189 | Fair $46,059 |
| French Canadians | 36.1 /100 | #190 | Fair $46,026 |
| Finns | 33.4 /100 | #191 | Fair $45,940 |
| Germans | 33.2 /100 | #192 | Fair $45,935 |
| Guamanians/Chamorros | 33.2 /100 | #193 | Fair $45,933 |