Immigrants from Ghana vs Vietnamese Per Capita Income
COMPARE
Immigrants from Ghana
Vietnamese
Per Capita Income
Per Capita Income Comparison
Immigrants from Ghana
Vietnamese
$41,131
PER CAPITA INCOME
5.5/ 100
METRIC RATING
227th/ 347
METRIC RANK
$42,368
PER CAPITA INCOME
19.0/ 100
METRIC RATING
200th/ 347
METRIC RANK
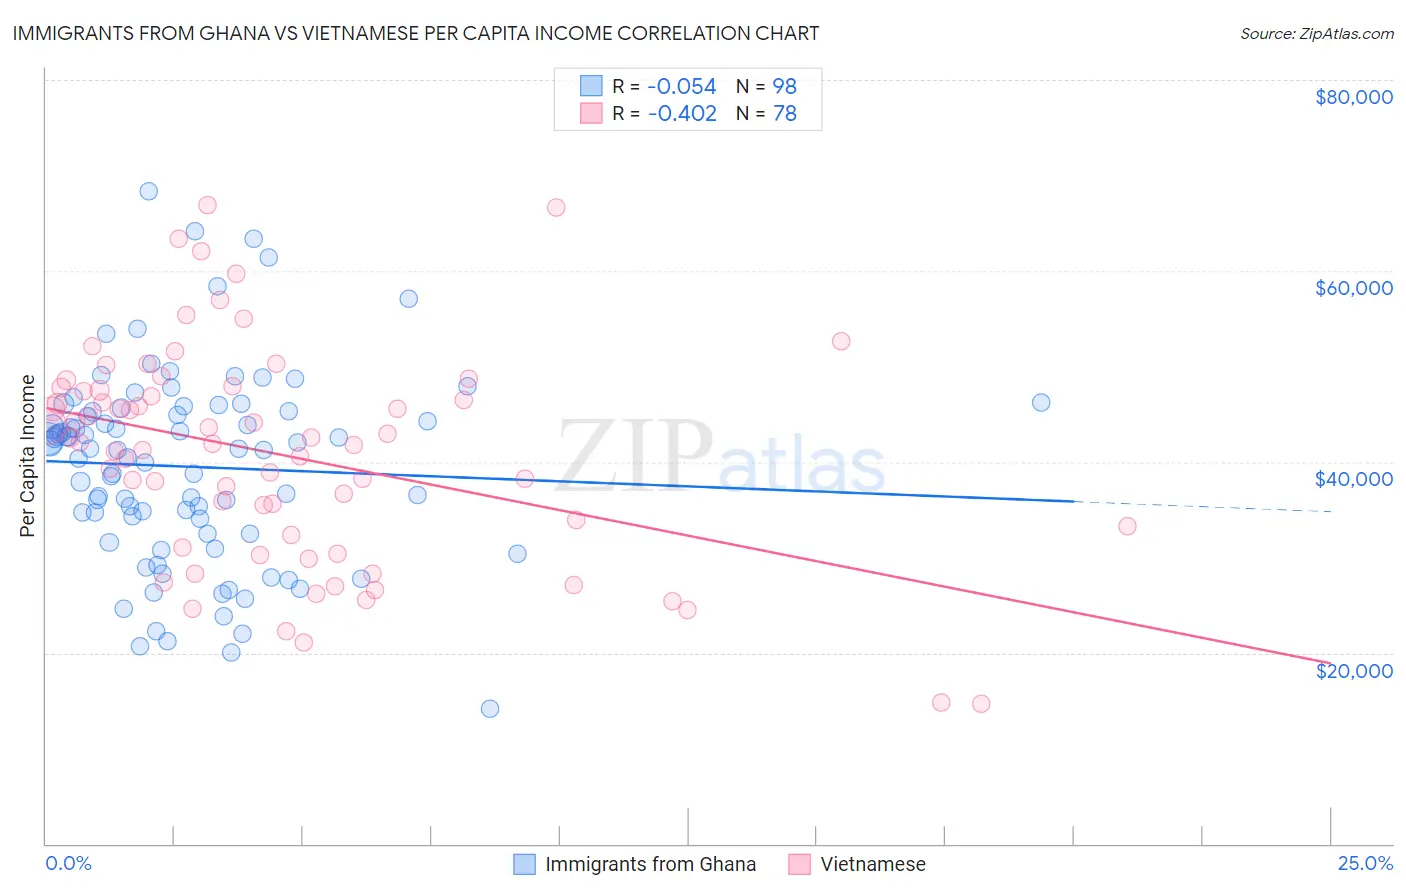
Immigrants from Ghana vs Vietnamese Per Capita Income Correlation Chart
The statistical analysis conducted on geographies consisting of 199,964,611 people shows a slight negative correlation between the proportion of Immigrants from Ghana and per capita income in the United States with a correlation coefficient (R) of -0.054 and weighted average of $41,131. Similarly, the statistical analysis conducted on geographies consisting of 170,759,165 people shows a moderate negative correlation between the proportion of Vietnamese and per capita income in the United States with a correlation coefficient (R) of -0.402 and weighted average of $42,368, a difference of 3.0%.
Per Capita Income Correlation Summary
| Measurement | Immigrants from Ghana | Vietnamese |
| Minimum | $14,179 | $14,629 |
| Maximum | $68,358 | $66,907 |
| Range | $54,179 | $52,278 |
| Mean | $39,490 | $40,731 |
| Median | $41,313 | $41,985 |
| Interquartile 25% (IQ1) | $32,441 | $32,361 |
| Interquartile 75% (IQ3) | $45,276 | $47,484 |
| Interquartile Range (IQR) | $12,835 | $15,123 |
| Standard Deviation (Sample) | $10,193 | $11,295 |
| Standard Deviation (Population) | $10,141 | $11,222 |
Similar Demographics by Per Capita Income
Demographics Similar to Immigrants from Ghana by Per Capita Income
In terms of per capita income, the demographic groups most similar to Immigrants from Ghana are Immigrants from Grenada ($41,123, a difference of 0.020%), Immigrants from Ecuador ($41,195, a difference of 0.16%), West Indian ($41,217, a difference of 0.21%), Nigerian ($41,026, a difference of 0.26%), and Native Hawaiian ($41,017, a difference of 0.28%).
| Demographics | Rating | Rank | Per Capita Income |
| Immigrants | Barbados | 7.9 /100 | #220 | Tragic $41,478 |
| Immigrants | Trinidad and Tobago | 7.9 /100 | #221 | Tragic $41,476 |
| Immigrants | Iraq | 7.1 /100 | #222 | Tragic $41,365 |
| Immigrants | Cameroon | 6.8 /100 | #223 | Tragic $41,334 |
| Immigrants | St. Vincent and the Grenadines | 6.4 /100 | #224 | Tragic $41,270 |
| West Indians | 6.0 /100 | #225 | Tragic $41,217 |
| Immigrants | Ecuador | 5.9 /100 | #226 | Tragic $41,195 |
| Immigrants | Ghana | 5.5 /100 | #227 | Tragic $41,131 |
| Immigrants | Grenada | 5.5 /100 | #228 | Tragic $41,123 |
| Nigerians | 4.9 /100 | #229 | Tragic $41,026 |
| Native Hawaiians | 4.9 /100 | #230 | Tragic $41,017 |
| Senegalese | 4.8 /100 | #231 | Tragic $41,000 |
| Guyanese | 4.5 /100 | #232 | Tragic $40,949 |
| Delaware | 3.8 /100 | #233 | Tragic $40,778 |
| Immigrants | West Indies | 3.7 /100 | #234 | Tragic $40,763 |
Demographics Similar to Vietnamese by Per Capita Income
In terms of per capita income, the demographic groups most similar to Vietnamese are Barbadian ($42,406, a difference of 0.090%), Immigrants from Portugal ($42,412, a difference of 0.10%), Immigrants from Thailand ($42,289, a difference of 0.19%), Immigrants from Bosnia and Herzegovina ($42,278, a difference of 0.21%), and Spanish ($42,249, a difference of 0.28%).
| Demographics | Rating | Rank | Per Capita Income |
| Immigrants | Sierra Leone | 26.5 /100 | #193 | Fair $42,752 |
| Immigrants | Fiji | 25.2 /100 | #194 | Fair $42,694 |
| Immigrants | Kenya | 24.5 /100 | #195 | Fair $42,661 |
| Dutch | 23.4 /100 | #196 | Fair $42,605 |
| Scotch-Irish | 22.6 /100 | #197 | Fair $42,563 |
| Immigrants | Portugal | 19.7 /100 | #198 | Poor $42,412 |
| Barbadians | 19.6 /100 | #199 | Poor $42,406 |
| Vietnamese | 19.0 /100 | #200 | Poor $42,368 |
| Immigrants | Thailand | 17.6 /100 | #201 | Poor $42,289 |
| Immigrants | Bosnia and Herzegovina | 17.5 /100 | #202 | Poor $42,278 |
| Spanish | 17.0 /100 | #203 | Poor $42,249 |
| Aleuts | 16.4 /100 | #204 | Poor $42,210 |
| Whites/Caucasians | 15.9 /100 | #205 | Poor $42,180 |
| Ghanaians | 15.7 /100 | #206 | Poor $42,164 |
| Venezuelans | 14.4 /100 | #207 | Poor $42,074 |