Immigrants from Fiji vs Vietnamese Median Earnings
COMPARE
Immigrants from Fiji
Vietnamese
Median Earnings
Median Earnings Comparison
Immigrants from Fiji
Vietnamese
$48,305
MEDIAN EARNINGS
93.3/ 100
METRIC RATING
125th/ 347
METRIC RANK
$46,172
MEDIAN EARNINGS
40.9/ 100
METRIC RATING
186th/ 347
METRIC RANK
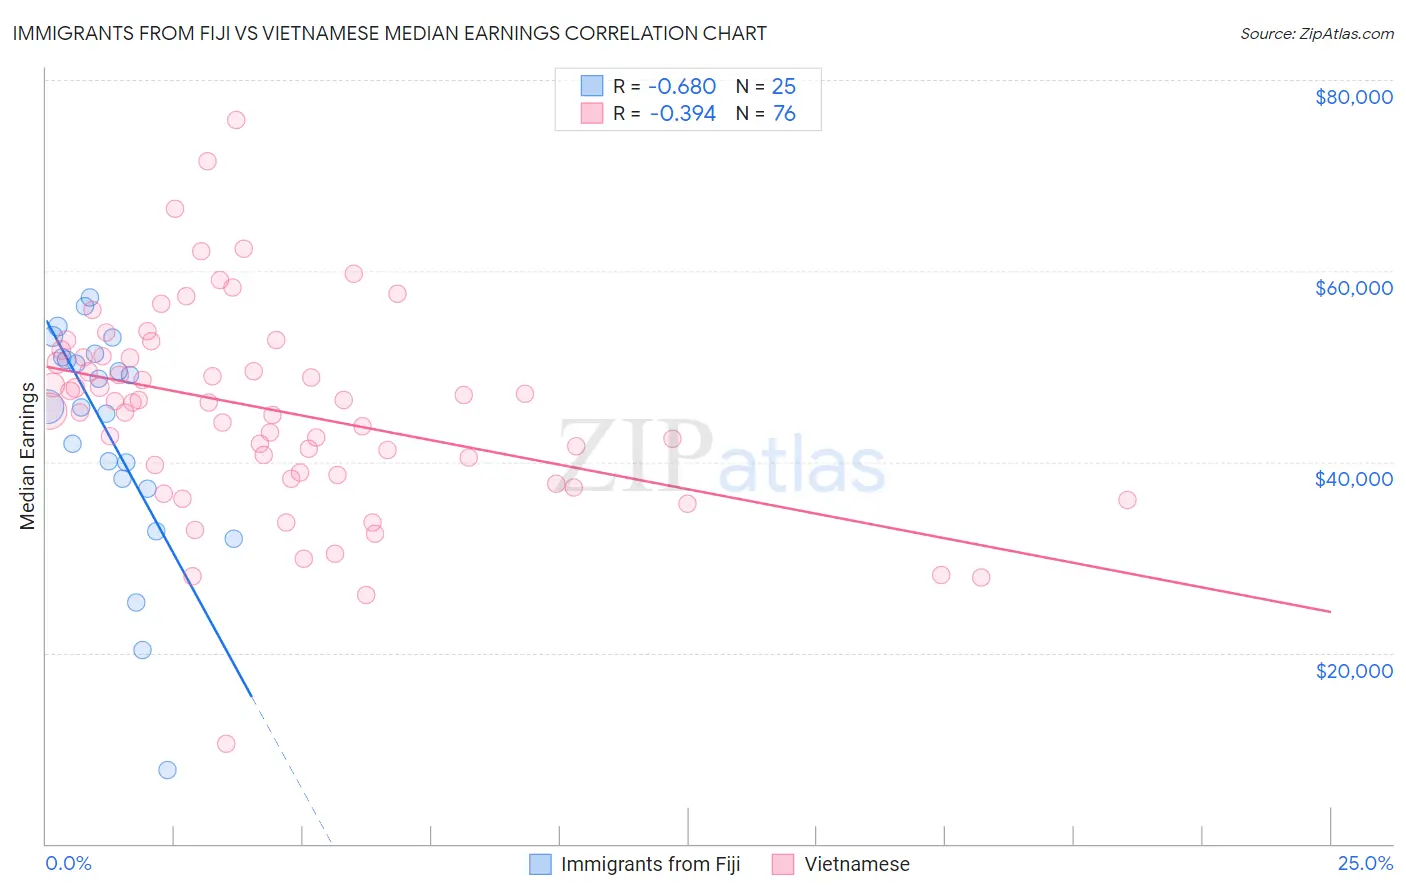
Immigrants from Fiji vs Vietnamese Median Earnings Correlation Chart
The statistical analysis conducted on geographies consisting of 93,756,016 people shows a significant negative correlation between the proportion of Immigrants from Fiji and median earnings in the United States with a correlation coefficient (R) of -0.680 and weighted average of $48,305. Similarly, the statistical analysis conducted on geographies consisting of 170,754,032 people shows a mild negative correlation between the proportion of Vietnamese and median earnings in the United States with a correlation coefficient (R) of -0.394 and weighted average of $46,172, a difference of 4.6%.
Median Earnings Correlation Summary
| Measurement | Immigrants from Fiji | Vietnamese |
| Minimum | $7,703 | $10,473 |
| Maximum | $57,229 | $75,862 |
| Range | $49,526 | $65,389 |
| Mean | $43,044 | $45,384 |
| Median | $45,776 | $46,190 |
| Interquartile 25% (IQ1) | $37,711 | $38,745 |
| Interquartile 75% (IQ3) | $51,118 | $50,994 |
| Interquartile Range (IQR) | $13,407 | $12,249 |
| Standard Deviation (Sample) | $12,014 | $10,718 |
| Standard Deviation (Population) | $11,772 | $10,647 |
Similar Demographics by Median Earnings
Demographics Similar to Immigrants from Fiji by Median Earnings
In terms of median earnings, the demographic groups most similar to Immigrants from Fiji are Assyrian/Chaldean/Syriac ($48,304, a difference of 0.0%), Sierra Leonean ($48,286, a difference of 0.040%), Immigrants from Philippines ($48,266, a difference of 0.080%), Brazilian ($48,356, a difference of 0.11%), and Pakistani ($48,254, a difference of 0.11%).
| Demographics | Rating | Rank | Median Earnings |
| Immigrants | Jordan | 95.9 /100 | #118 | Exceptional $48,673 |
| Poles | 95.8 /100 | #119 | Exceptional $48,659 |
| Carpatho Rusyns | 95.5 /100 | #120 | Exceptional $48,617 |
| Arabs | 95.4 /100 | #121 | Exceptional $48,599 |
| Chileans | 94.8 /100 | #122 | Exceptional $48,504 |
| Immigrants | Syria | 93.9 /100 | #123 | Exceptional $48,375 |
| Brazilians | 93.7 /100 | #124 | Exceptional $48,356 |
| Immigrants | Fiji | 93.3 /100 | #125 | Exceptional $48,305 |
| Assyrians/Chaldeans/Syriacs | 93.3 /100 | #126 | Exceptional $48,304 |
| Sierra Leoneans | 93.1 /100 | #127 | Exceptional $48,286 |
| Immigrants | Philippines | 92.9 /100 | #128 | Exceptional $48,266 |
| Pakistanis | 92.8 /100 | #129 | Exceptional $48,254 |
| Zimbabweans | 92.6 /100 | #130 | Exceptional $48,229 |
| Lebanese | 92.5 /100 | #131 | Exceptional $48,226 |
| British | 92.2 /100 | #132 | Exceptional $48,189 |
Demographics Similar to Vietnamese by Median Earnings
In terms of median earnings, the demographic groups most similar to Vietnamese are Uruguayan ($46,190, a difference of 0.040%), Iraqi ($46,140, a difference of 0.070%), Immigrants from Kenya ($46,214, a difference of 0.090%), Immigrants from Armenia ($46,094, a difference of 0.17%), and Spaniard ($46,059, a difference of 0.24%).
| Demographics | Rating | Rank | Median Earnings |
| English | 46.5 /100 | #179 | Average $46,334 |
| Puget Sound Salish | 46.5 /100 | #180 | Average $46,333 |
| Immigrants | Cameroon | 46.4 /100 | #181 | Average $46,329 |
| Swiss | 45.9 /100 | #182 | Average $46,315 |
| French | 45.2 /100 | #183 | Average $46,296 |
| Immigrants | Kenya | 42.4 /100 | #184 | Average $46,214 |
| Uruguayans | 41.6 /100 | #185 | Average $46,190 |
| Vietnamese | 40.9 /100 | #186 | Average $46,172 |
| Iraqis | 39.9 /100 | #187 | Fair $46,140 |
| Immigrants | Armenia | 38.3 /100 | #188 | Fair $46,094 |
| Spaniards | 37.2 /100 | #189 | Fair $46,059 |
| French Canadians | 36.1 /100 | #190 | Fair $46,026 |
| Finns | 33.4 /100 | #191 | Fair $45,940 |
| Germans | 33.2 /100 | #192 | Fair $45,935 |
| Guamanians/Chamorros | 33.2 /100 | #193 | Fair $45,933 |