Immigrants from Ghana vs Central American Indian Median Earnings
COMPARE
Immigrants from Ghana
Central American Indian
Median Earnings
Median Earnings Comparison
Immigrants from Ghana
Central American Indians
$45,641
MEDIAN EARNINGS
24.8/ 100
METRIC RATING
206th/ 347
METRIC RANK
$41,474
MEDIAN EARNINGS
0.1/ 100
METRIC RATING
291st/ 347
METRIC RANK
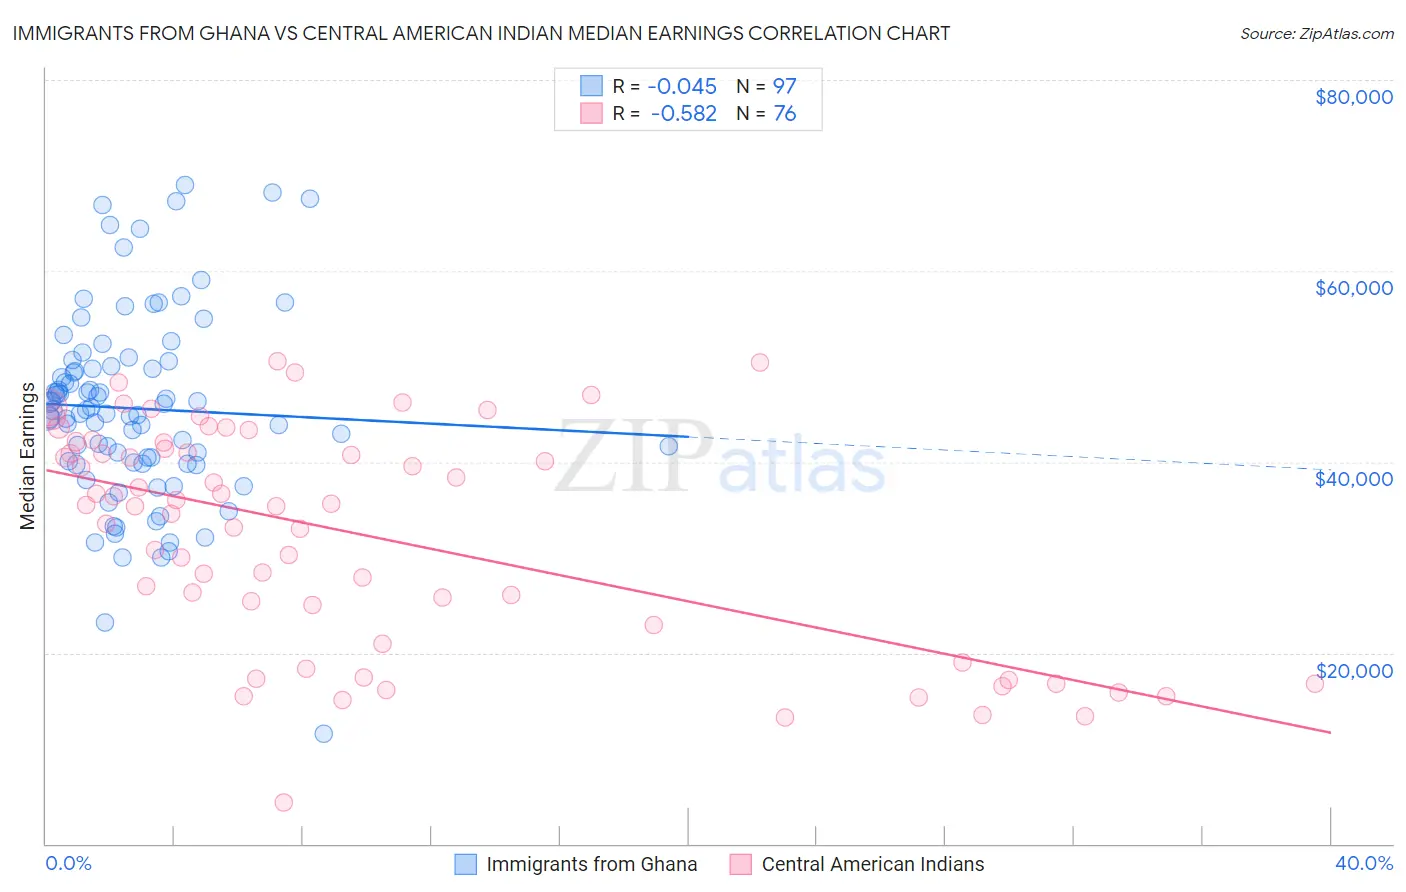
Immigrants from Ghana vs Central American Indian Median Earnings Correlation Chart
The statistical analysis conducted on geographies consisting of 199,945,483 people shows no correlation between the proportion of Immigrants from Ghana and median earnings in the United States with a correlation coefficient (R) of -0.045 and weighted average of $45,641. Similarly, the statistical analysis conducted on geographies consisting of 326,124,728 people shows a substantial negative correlation between the proportion of Central American Indians and median earnings in the United States with a correlation coefficient (R) of -0.582 and weighted average of $41,474, a difference of 10.1%.
Median Earnings Correlation Summary
| Measurement | Immigrants from Ghana | Central American Indian |
| Minimum | $11,479 | $4,300 |
| Maximum | $69,009 | $50,550 |
| Range | $57,530 | $46,250 |
| Mean | $45,584 | $32,321 |
| Median | $45,406 | $35,426 |
| Interquartile 25% (IQ1) | $39,912 | $21,944 |
| Interquartile 75% (IQ3) | $50,257 | $41,662 |
| Interquartile Range (IQR) | $10,345 | $19,717 |
| Standard Deviation (Sample) | $10,012 | $11,652 |
| Standard Deviation (Population) | $9,960 | $11,575 |
Similar Demographics by Median Earnings
Demographics Similar to Immigrants from Ghana by Median Earnings
In terms of median earnings, the demographic groups most similar to Immigrants from Ghana are Tongan ($45,665, a difference of 0.050%), Immigrants from Senegal ($45,611, a difference of 0.070%), Immigrants from Uruguay ($45,682, a difference of 0.090%), Immigrants from Bosnia and Herzegovina ($45,600, a difference of 0.090%), and Immigrants from Thailand ($45,598, a difference of 0.10%).
| Demographics | Rating | Rank | Median Earnings |
| Immigrants | Barbados | 29.6 /100 | #199 | Fair $45,816 |
| Immigrants | Azores | 29.5 /100 | #200 | Fair $45,812 |
| Celtics | 27.2 /100 | #201 | Fair $45,732 |
| Immigrants | Trinidad and Tobago | 27.1 /100 | #202 | Fair $45,729 |
| Welsh | 26.6 /100 | #203 | Fair $45,710 |
| Immigrants | Uruguay | 25.9 /100 | #204 | Fair $45,682 |
| Tongans | 25.4 /100 | #205 | Fair $45,665 |
| Immigrants | Ghana | 24.8 /100 | #206 | Fair $45,641 |
| Immigrants | Senegal | 24.0 /100 | #207 | Fair $45,611 |
| Immigrants | Bosnia and Herzegovina | 23.7 /100 | #208 | Fair $45,600 |
| Immigrants | Thailand | 23.7 /100 | #209 | Fair $45,598 |
| Immigrants | Grenada | 23.6 /100 | #210 | Fair $45,596 |
| Panamanians | 23.5 /100 | #211 | Fair $45,593 |
| Bermudans | 23.5 /100 | #212 | Fair $45,593 |
| Immigrants | Colombia | 22.4 /100 | #213 | Fair $45,550 |
Demographics Similar to Central American Indians by Median Earnings
In terms of median earnings, the demographic groups most similar to Central American Indians are U.S. Virgin Islander ($41,448, a difference of 0.060%), Paiute ($41,508, a difference of 0.080%), Comanche ($41,519, a difference of 0.11%), Immigrants from Dominican Republic ($41,554, a difference of 0.19%), and Immigrants from Zaire ($41,325, a difference of 0.36%).
| Demographics | Rating | Rank | Median Earnings |
| Blackfeet | 0.2 /100 | #284 | Tragic $41,822 |
| Immigrants | Nicaragua | 0.1 /100 | #285 | Tragic $41,737 |
| Mexican American Indians | 0.1 /100 | #286 | Tragic $41,719 |
| Indonesians | 0.1 /100 | #287 | Tragic $41,701 |
| Immigrants | Dominican Republic | 0.1 /100 | #288 | Tragic $41,554 |
| Comanche | 0.1 /100 | #289 | Tragic $41,519 |
| Paiute | 0.1 /100 | #290 | Tragic $41,508 |
| Central American Indians | 0.1 /100 | #291 | Tragic $41,474 |
| U.S. Virgin Islanders | 0.1 /100 | #292 | Tragic $41,448 |
| Immigrants | Zaire | 0.1 /100 | #293 | Tragic $41,325 |
| Potawatomi | 0.1 /100 | #294 | Tragic $41,288 |
| Bangladeshis | 0.1 /100 | #295 | Tragic $41,263 |
| Cherokee | 0.1 /100 | #296 | Tragic $41,252 |
| Guatemalans | 0.1 /100 | #297 | Tragic $41,205 |
| Immigrants | Micronesia | 0.1 /100 | #298 | Tragic $41,133 |