Immigrants from South Central Asia vs Vietnamese Median Earnings
COMPARE
Immigrants from South Central Asia
Vietnamese
Median Earnings
Median Earnings Comparison
Immigrants from South Central Asia
Vietnamese
$57,114
MEDIAN EARNINGS
100.0/ 100
METRIC RATING
10th/ 347
METRIC RANK
$46,172
MEDIAN EARNINGS
40.9/ 100
METRIC RATING
186th/ 347
METRIC RANK
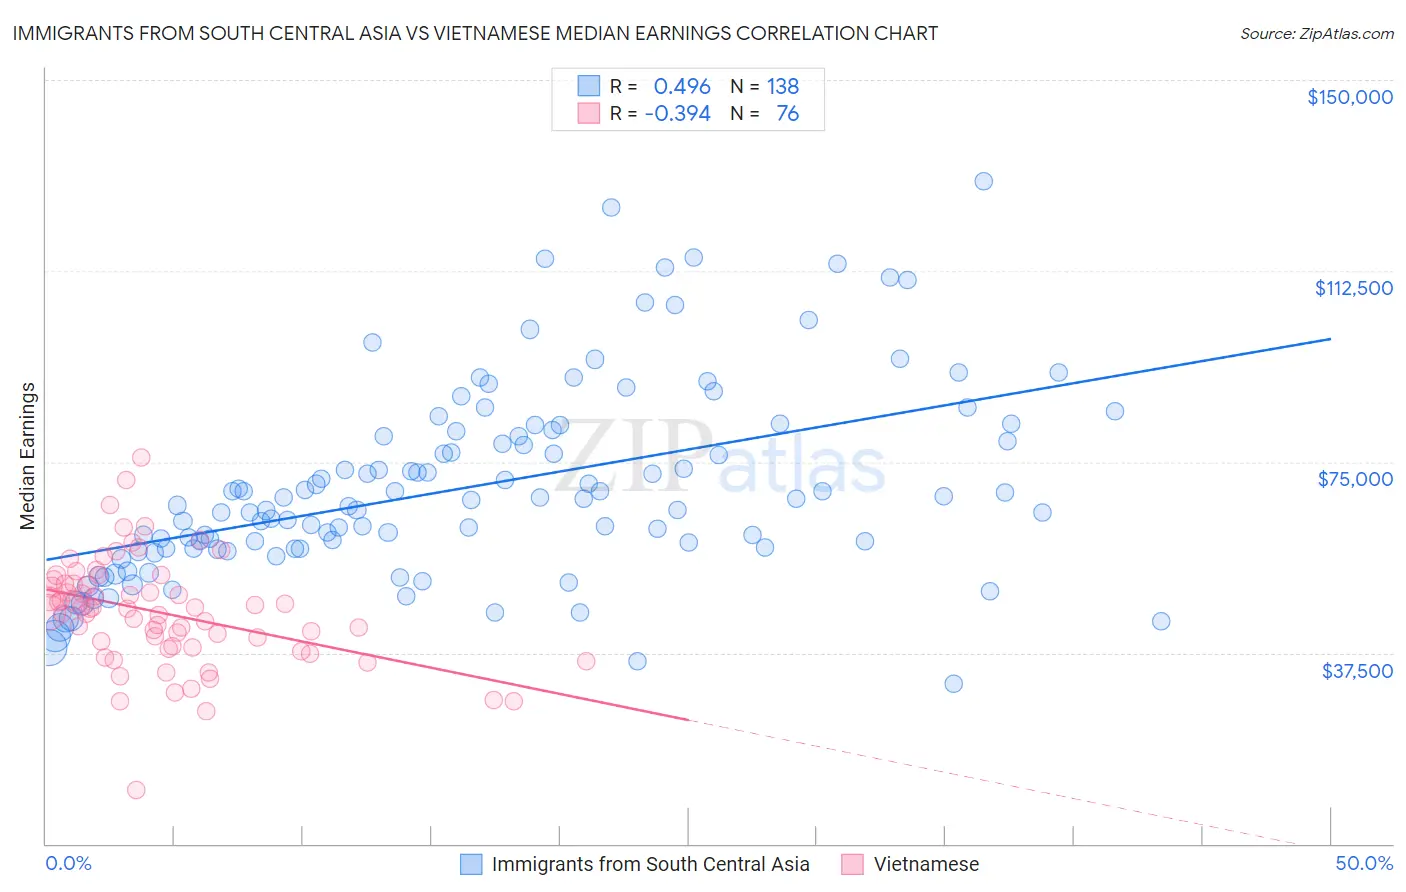
Immigrants from South Central Asia vs Vietnamese Median Earnings Correlation Chart
The statistical analysis conducted on geographies consisting of 473,088,243 people shows a moderate positive correlation between the proportion of Immigrants from South Central Asia and median earnings in the United States with a correlation coefficient (R) of 0.496 and weighted average of $57,114. Similarly, the statistical analysis conducted on geographies consisting of 170,754,032 people shows a mild negative correlation between the proportion of Vietnamese and median earnings in the United States with a correlation coefficient (R) of -0.394 and weighted average of $46,172, a difference of 23.7%.
Median Earnings Correlation Summary
| Measurement | Immigrants from South Central Asia | Vietnamese |
| Minimum | $31,327 | $10,473 |
| Maximum | $130,186 | $75,862 |
| Range | $98,859 | $65,389 |
| Mean | $69,984 | $45,384 |
| Median | $66,961 | $46,190 |
| Interquartile 25% (IQ1) | $57,896 | $38,745 |
| Interquartile 75% (IQ3) | $80,093 | $50,994 |
| Interquartile Range (IQR) | $22,197 | $12,249 |
| Standard Deviation (Sample) | $19,016 | $10,718 |
| Standard Deviation (Population) | $18,947 | $10,647 |
Similar Demographics by Median Earnings
Demographics Similar to Immigrants from South Central Asia by Median Earnings
In terms of median earnings, the demographic groups most similar to Immigrants from South Central Asia are Immigrants from Israel ($57,034, a difference of 0.14%), Immigrants from Ireland ($56,854, a difference of 0.46%), Okinawan ($57,550, a difference of 0.76%), Immigrants from China ($56,638, a difference of 0.84%), and Immigrants from Iran ($57,612, a difference of 0.87%).
| Demographics | Rating | Rank | Median Earnings |
| Immigrants | India | 100.0 /100 | #3 | Exceptional $60,648 |
| Immigrants | Hong Kong | 100.0 /100 | #4 | Exceptional $59,433 |
| Thais | 100.0 /100 | #5 | Exceptional $59,237 |
| Immigrants | Singapore | 100.0 /100 | #6 | Exceptional $59,038 |
| Iranians | 100.0 /100 | #7 | Exceptional $58,474 |
| Immigrants | Iran | 100.0 /100 | #8 | Exceptional $57,612 |
| Okinawans | 100.0 /100 | #9 | Exceptional $57,550 |
| Immigrants | South Central Asia | 100.0 /100 | #10 | Exceptional $57,114 |
| Immigrants | Israel | 100.0 /100 | #11 | Exceptional $57,034 |
| Immigrants | Ireland | 100.0 /100 | #12 | Exceptional $56,854 |
| Immigrants | China | 100.0 /100 | #13 | Exceptional $56,638 |
| Immigrants | Australia | 100.0 /100 | #14 | Exceptional $56,305 |
| Indians (Asian) | 100.0 /100 | #15 | Exceptional $56,253 |
| Immigrants | Eastern Asia | 100.0 /100 | #16 | Exceptional $56,183 |
| Eastern Europeans | 100.0 /100 | #17 | Exceptional $55,084 |
Demographics Similar to Vietnamese by Median Earnings
In terms of median earnings, the demographic groups most similar to Vietnamese are Uruguayan ($46,190, a difference of 0.040%), Iraqi ($46,140, a difference of 0.070%), Immigrants from Kenya ($46,214, a difference of 0.090%), Immigrants from Armenia ($46,094, a difference of 0.17%), and Spaniard ($46,059, a difference of 0.24%).
| Demographics | Rating | Rank | Median Earnings |
| English | 46.5 /100 | #179 | Average $46,334 |
| Puget Sound Salish | 46.5 /100 | #180 | Average $46,333 |
| Immigrants | Cameroon | 46.4 /100 | #181 | Average $46,329 |
| Swiss | 45.9 /100 | #182 | Average $46,315 |
| French | 45.2 /100 | #183 | Average $46,296 |
| Immigrants | Kenya | 42.4 /100 | #184 | Average $46,214 |
| Uruguayans | 41.6 /100 | #185 | Average $46,190 |
| Vietnamese | 40.9 /100 | #186 | Average $46,172 |
| Iraqis | 39.9 /100 | #187 | Fair $46,140 |
| Immigrants | Armenia | 38.3 /100 | #188 | Fair $46,094 |
| Spaniards | 37.2 /100 | #189 | Fair $46,059 |
| French Canadians | 36.1 /100 | #190 | Fair $46,026 |
| Finns | 33.4 /100 | #191 | Fair $45,940 |
| Germans | 33.2 /100 | #192 | Fair $45,935 |
| Guamanians/Chamorros | 33.2 /100 | #193 | Fair $45,933 |