Immigrants from Europe vs Immigrants from Eastern Africa Median Earnings
COMPARE
Immigrants from Europe
Immigrants from Eastern Africa
Median Earnings
Median Earnings Comparison
Immigrants from Europe
Immigrants from Eastern Africa
$52,195
MEDIAN EARNINGS
100.0/ 100
METRIC RATING
48th/ 347
METRIC RANK
$46,969
MEDIAN EARNINGS
68.0/ 100
METRIC RATING
161st/ 347
METRIC RANK
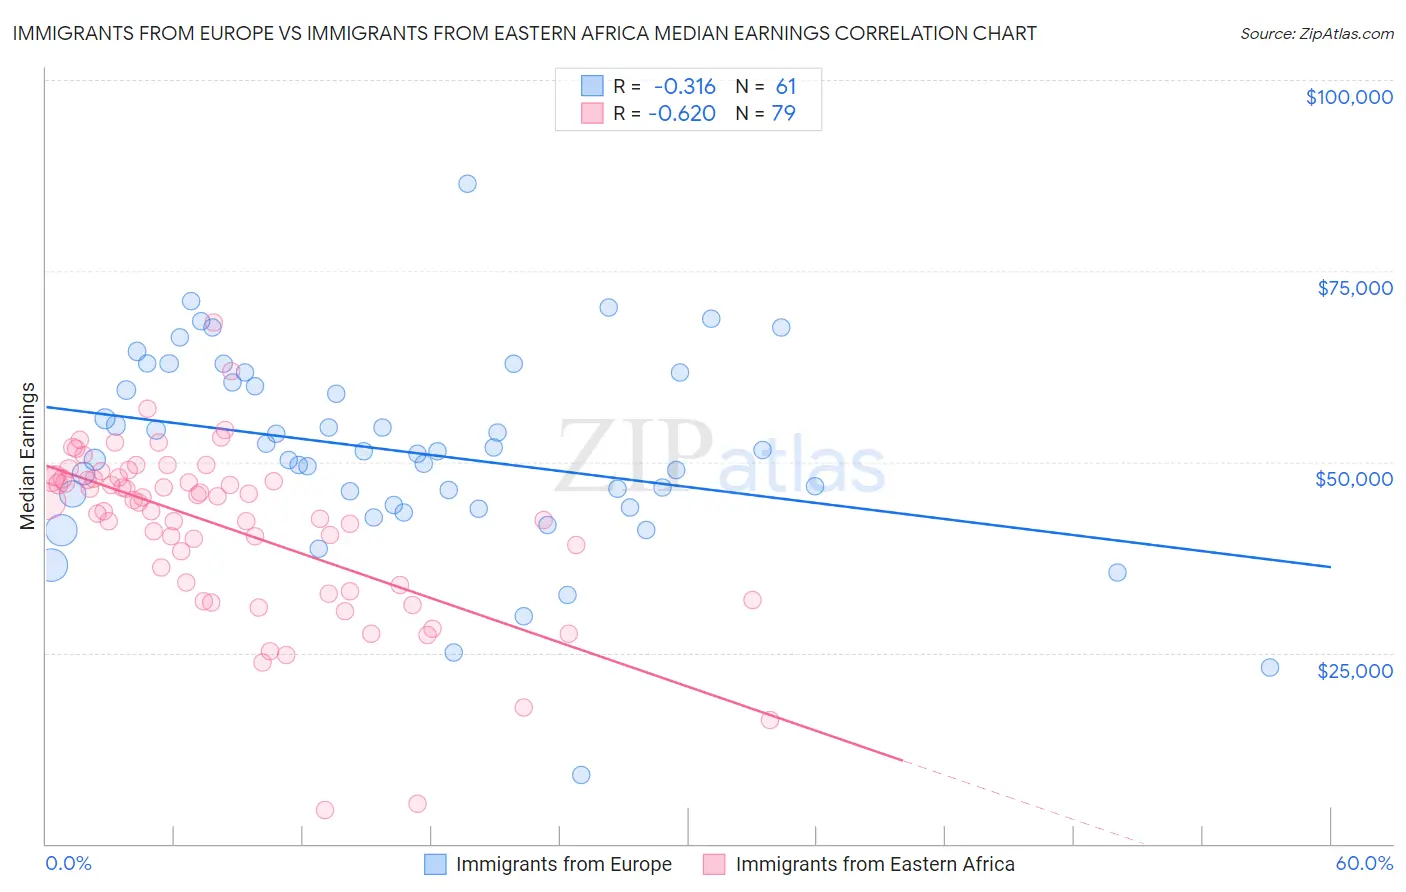
Immigrants from Europe vs Immigrants from Eastern Africa Median Earnings Correlation Chart
The statistical analysis conducted on geographies consisting of 547,237,695 people shows a mild negative correlation between the proportion of Immigrants from Europe and median earnings in the United States with a correlation coefficient (R) of -0.316 and weighted average of $52,195. Similarly, the statistical analysis conducted on geographies consisting of 355,152,385 people shows a significant negative correlation between the proportion of Immigrants from Eastern Africa and median earnings in the United States with a correlation coefficient (R) of -0.620 and weighted average of $46,969, a difference of 11.1%.
Median Earnings Correlation Summary
| Measurement | Immigrants from Europe | Immigrants from Eastern Africa |
| Minimum | $9,082 | $4,426 |
| Maximum | $86,483 | $68,236 |
| Range | $77,401 | $63,810 |
| Mean | $51,354 | $41,397 |
| Median | $51,399 | $44,805 |
| Interquartile 25% (IQ1) | $44,212 | $33,958 |
| Interquartile 75% (IQ3) | $60,990 | $47,783 |
| Interquartile Range (IQR) | $16,778 | $13,825 |
| Standard Deviation (Sample) | $12,967 | $11,219 |
| Standard Deviation (Population) | $12,860 | $11,147 |
Similar Demographics by Median Earnings
Demographics Similar to Immigrants from Europe by Median Earnings
In terms of median earnings, the demographic groups most similar to Immigrants from Europe are Australian ($52,294, a difference of 0.19%), Bhutanese ($52,297, a difference of 0.20%), Immigrants from Czechoslovakia ($52,361, a difference of 0.32%), Bolivian ($52,005, a difference of 0.37%), and Immigrants from Malaysia ($52,514, a difference of 0.61%).
| Demographics | Rating | Rank | Median Earnings |
| Immigrants | Lithuania | 100.0 /100 | #41 | Exceptional $52,769 |
| Maltese | 100.0 /100 | #42 | Exceptional $52,526 |
| Immigrants | Malaysia | 100.0 /100 | #43 | Exceptional $52,514 |
| Bulgarians | 100.0 /100 | #44 | Exceptional $52,512 |
| Immigrants | Czechoslovakia | 100.0 /100 | #45 | Exceptional $52,361 |
| Bhutanese | 100.0 /100 | #46 | Exceptional $52,297 |
| Australians | 100.0 /100 | #47 | Exceptional $52,294 |
| Immigrants | Europe | 100.0 /100 | #48 | Exceptional $52,195 |
| Bolivians | 100.0 /100 | #49 | Exceptional $52,005 |
| Immigrants | South Africa | 100.0 /100 | #50 | Exceptional $51,850 |
| Immigrants | Austria | 99.9 /100 | #51 | Exceptional $51,826 |
| Estonians | 99.9 /100 | #52 | Exceptional $51,772 |
| Immigrants | Norway | 99.9 /100 | #53 | Exceptional $51,758 |
| Immigrants | Indonesia | 99.9 /100 | #54 | Exceptional $51,715 |
| Egyptians | 99.9 /100 | #55 | Exceptional $51,701 |
Demographics Similar to Immigrants from Eastern Africa by Median Earnings
In terms of median earnings, the demographic groups most similar to Immigrants from Eastern Africa are South American Indian ($46,952, a difference of 0.040%), Alsatian ($47,023, a difference of 0.11%), Icelander ($46,916, a difference of 0.11%), Immigrants from Peru ($47,025, a difference of 0.12%), and Norwegian ($46,865, a difference of 0.22%).
| Demographics | Rating | Rank | Median Earnings |
| Immigrants | Portugal | 77.3 /100 | #154 | Good $47,304 |
| Immigrants | Vietnam | 76.7 /100 | #155 | Good $47,282 |
| Irish | 76.6 /100 | #156 | Good $47,276 |
| Czechs | 75.1 /100 | #157 | Good $47,221 |
| Slovaks | 71.7 /100 | #158 | Good $47,095 |
| Immigrants | Peru | 69.6 /100 | #159 | Good $47,025 |
| Alsatians | 69.6 /100 | #160 | Good $47,023 |
| Immigrants | Eastern Africa | 68.0 /100 | #161 | Good $46,969 |
| South American Indians | 67.4 /100 | #162 | Good $46,952 |
| Icelanders | 66.3 /100 | #163 | Good $46,916 |
| Norwegians | 64.7 /100 | #164 | Good $46,865 |
| South Americans | 62.7 /100 | #165 | Good $46,804 |
| Czechoslovakians | 57.8 /100 | #166 | Average $46,658 |
| Costa Ricans | 57.4 /100 | #167 | Average $46,645 |
| Immigrants | Africa | 54.6 /100 | #168 | Average $46,564 |