Immigrants from Europe vs Austrian Median Earnings
COMPARE
Immigrants from Europe
Austrian
Median Earnings
Median Earnings Comparison
Immigrants from Europe
Austrians
$52,195
MEDIAN EARNINGS
100.0/ 100
METRIC RATING
48th/ 347
METRIC RANK
$49,501
MEDIAN EARNINGS
98.7/ 100
METRIC RATING
103rd/ 347
METRIC RANK
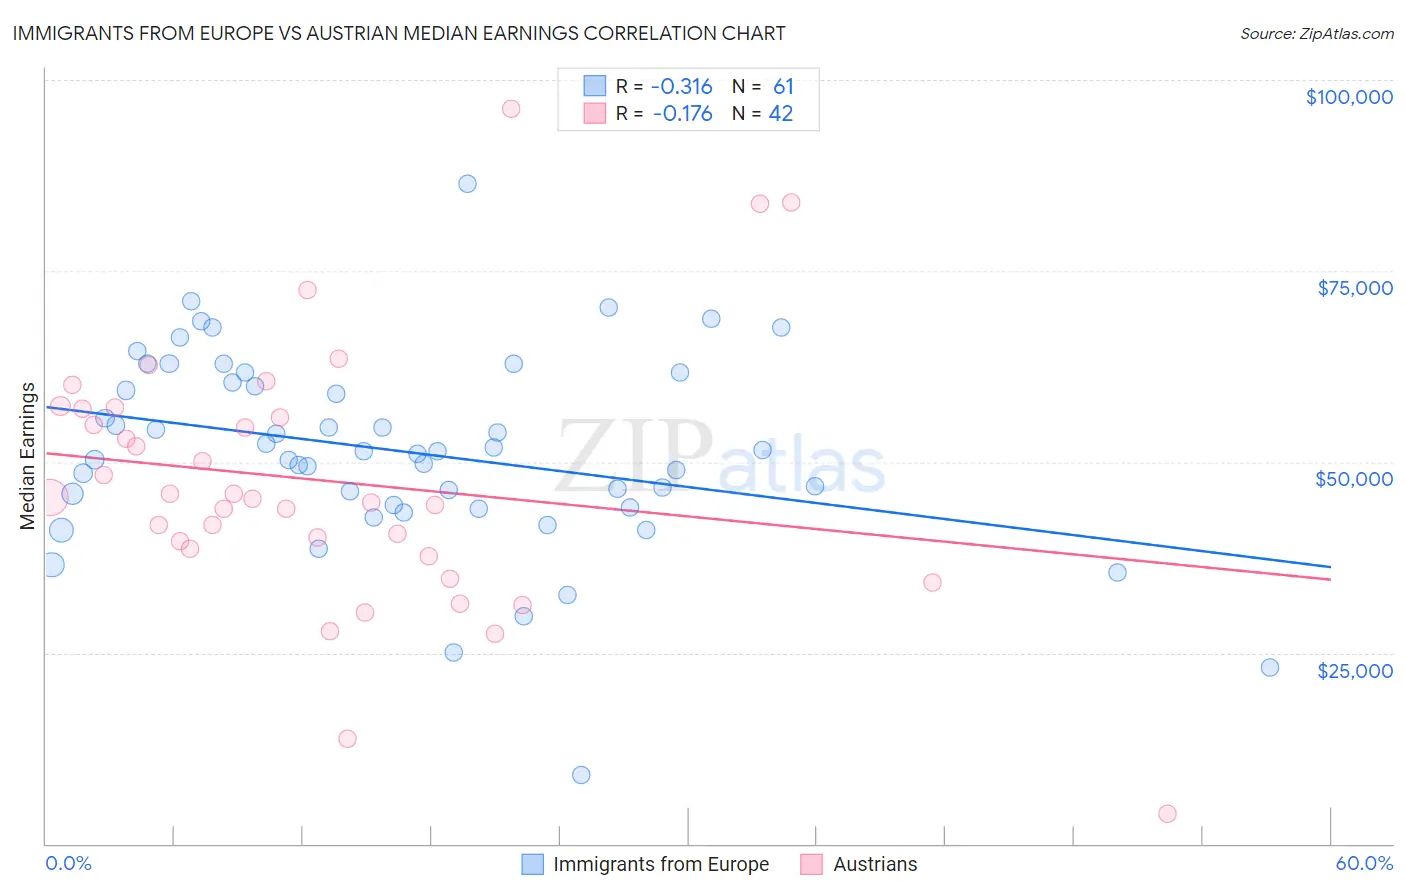
Immigrants from Europe vs Austrian Median Earnings Correlation Chart
The statistical analysis conducted on geographies consisting of 547,237,695 people shows a mild negative correlation between the proportion of Immigrants from Europe and median earnings in the United States with a correlation coefficient (R) of -0.316 and weighted average of $52,195. Similarly, the statistical analysis conducted on geographies consisting of 452,042,983 people shows a poor negative correlation between the proportion of Austrians and median earnings in the United States with a correlation coefficient (R) of -0.176 and weighted average of $49,501, a difference of 5.4%.
Median Earnings Correlation Summary
| Measurement | Immigrants from Europe | Austrian |
| Minimum | $9,082 | $3,902 |
| Maximum | $86,483 | $96,250 |
| Range | $77,401 | $92,348 |
| Mean | $51,354 | $47,542 |
| Median | $51,399 | $45,255 |
| Interquartile 25% (IQ1) | $44,212 | $38,609 |
| Interquartile 75% (IQ3) | $60,990 | $56,967 |
| Interquartile Range (IQR) | $16,778 | $18,358 |
| Standard Deviation (Sample) | $12,967 | $17,409 |
| Standard Deviation (Population) | $12,860 | $17,200 |
Similar Demographics by Median Earnings
Demographics Similar to Immigrants from Europe by Median Earnings
In terms of median earnings, the demographic groups most similar to Immigrants from Europe are Australian ($52,294, a difference of 0.19%), Bhutanese ($52,297, a difference of 0.20%), Immigrants from Czechoslovakia ($52,361, a difference of 0.32%), Bolivian ($52,005, a difference of 0.37%), and Immigrants from Malaysia ($52,514, a difference of 0.61%).
| Demographics | Rating | Rank | Median Earnings |
| Immigrants | Lithuania | 100.0 /100 | #41 | Exceptional $52,769 |
| Maltese | 100.0 /100 | #42 | Exceptional $52,526 |
| Immigrants | Malaysia | 100.0 /100 | #43 | Exceptional $52,514 |
| Bulgarians | 100.0 /100 | #44 | Exceptional $52,512 |
| Immigrants | Czechoslovakia | 100.0 /100 | #45 | Exceptional $52,361 |
| Bhutanese | 100.0 /100 | #46 | Exceptional $52,297 |
| Australians | 100.0 /100 | #47 | Exceptional $52,294 |
| Immigrants | Europe | 100.0 /100 | #48 | Exceptional $52,195 |
| Bolivians | 100.0 /100 | #49 | Exceptional $52,005 |
| Immigrants | South Africa | 100.0 /100 | #50 | Exceptional $51,850 |
| Immigrants | Austria | 99.9 /100 | #51 | Exceptional $51,826 |
| Estonians | 99.9 /100 | #52 | Exceptional $51,772 |
| Immigrants | Norway | 99.9 /100 | #53 | Exceptional $51,758 |
| Immigrants | Indonesia | 99.9 /100 | #54 | Exceptional $51,715 |
| Egyptians | 99.9 /100 | #55 | Exceptional $51,701 |
Demographics Similar to Austrians by Median Earnings
In terms of median earnings, the demographic groups most similar to Austrians are Immigrants from Brazil ($49,463, a difference of 0.080%), Ethiopian ($49,572, a difference of 0.14%), Immigrants from Western Asia ($49,389, a difference of 0.23%), Immigrants from Albania ($49,377, a difference of 0.25%), and Immigrants from Poland ($49,633, a difference of 0.27%).
| Demographics | Rating | Rank | Median Earnings |
| Immigrants | Lebanon | 99.0 /100 | #96 | Exceptional $49,682 |
| Immigrants | North Macedonia | 98.9 /100 | #97 | Exceptional $49,658 |
| Immigrants | Northern Africa | 98.9 /100 | #98 | Exceptional $49,648 |
| Immigrants | Afghanistan | 98.9 /100 | #99 | Exceptional $49,645 |
| Immigrants | Poland | 98.9 /100 | #100 | Exceptional $49,633 |
| Jordanians | 98.9 /100 | #101 | Exceptional $49,632 |
| Ethiopians | 98.8 /100 | #102 | Exceptional $49,572 |
| Austrians | 98.7 /100 | #103 | Exceptional $49,501 |
| Immigrants | Brazil | 98.6 /100 | #104 | Exceptional $49,463 |
| Immigrants | Western Asia | 98.4 /100 | #105 | Exceptional $49,389 |
| Immigrants | Albania | 98.4 /100 | #106 | Exceptional $49,377 |
| Immigrants | Morocco | 98.4 /100 | #107 | Exceptional $49,368 |
| Palestinians | 98.0 /100 | #108 | Exceptional $49,209 |
| Syrians | 97.1 /100 | #109 | Exceptional $48,934 |
| Immigrants | Ethiopia | 97.1 /100 | #110 | Exceptional $48,924 |