Immigrants from Europe vs Immigrants from Lithuania Median Earnings
COMPARE
Immigrants from Europe
Immigrants from Lithuania
Median Earnings
Median Earnings Comparison
Immigrants from Europe
Immigrants from Lithuania
$52,195
MEDIAN EARNINGS
100.0/ 100
METRIC RATING
48th/ 347
METRIC RANK
$52,769
MEDIAN EARNINGS
100.0/ 100
METRIC RATING
41st/ 347
METRIC RANK
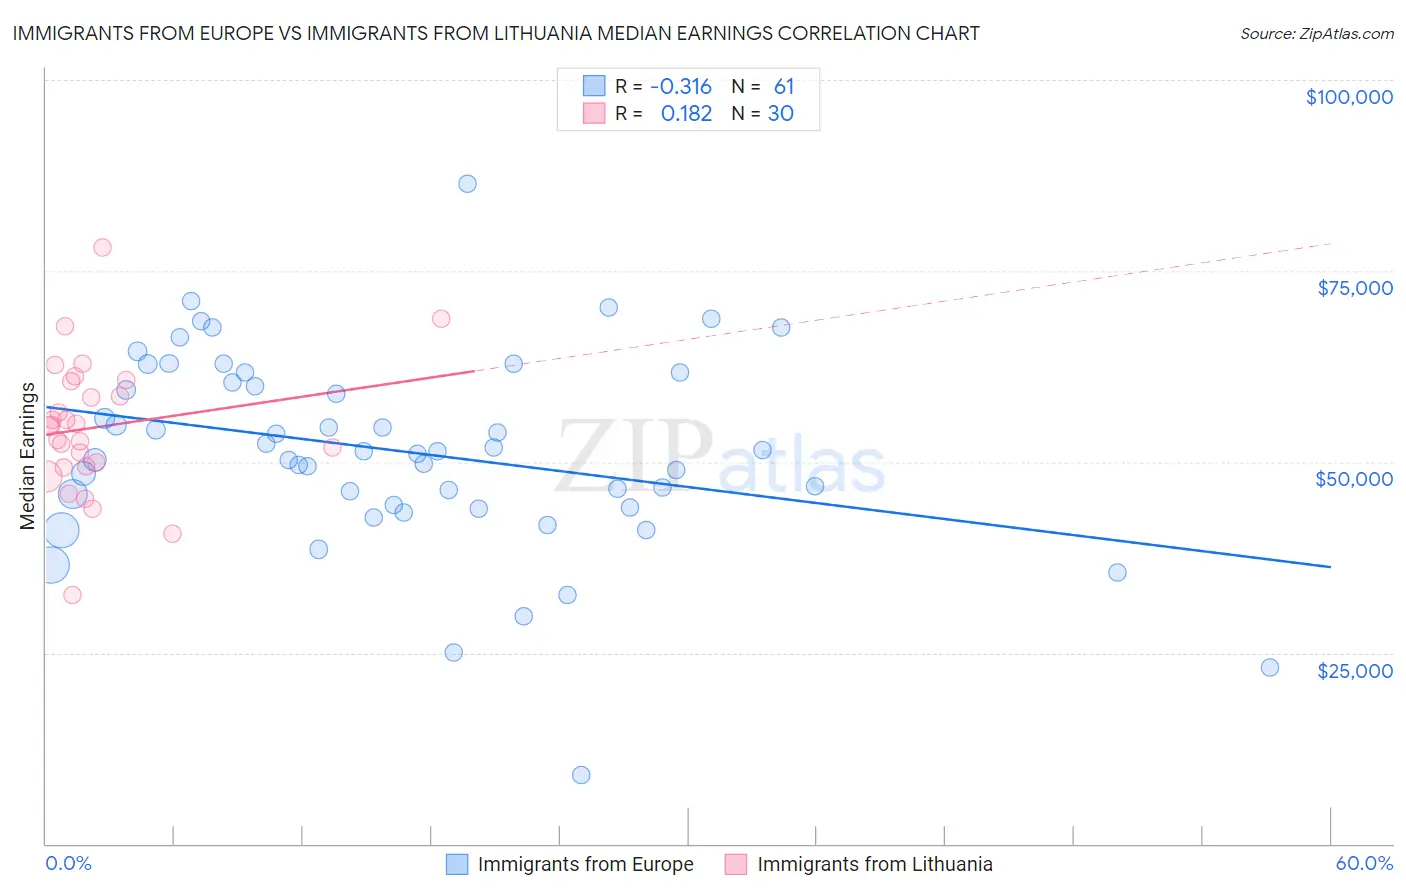
Immigrants from Europe vs Immigrants from Lithuania Median Earnings Correlation Chart
The statistical analysis conducted on geographies consisting of 547,237,695 people shows a mild negative correlation between the proportion of Immigrants from Europe and median earnings in the United States with a correlation coefficient (R) of -0.316 and weighted average of $52,195. Similarly, the statistical analysis conducted on geographies consisting of 117,724,669 people shows a poor positive correlation between the proportion of Immigrants from Lithuania and median earnings in the United States with a correlation coefficient (R) of 0.182 and weighted average of $52,769, a difference of 1.1%.
Median Earnings Correlation Summary
| Measurement | Immigrants from Europe | Immigrants from Lithuania |
| Minimum | $9,082 | $32,646 |
| Maximum | $86,483 | $78,046 |
| Range | $77,401 | $45,400 |
| Mean | $51,354 | $54,582 |
| Median | $51,399 | $54,749 |
| Interquartile 25% (IQ1) | $44,212 | $49,388 |
| Interquartile 75% (IQ3) | $60,990 | $60,605 |
| Interquartile Range (IQR) | $16,778 | $11,217 |
| Standard Deviation (Sample) | $12,967 | $8,932 |
| Standard Deviation (Population) | $12,860 | $8,782 |
Demographics Similar to Immigrants from Europe and Immigrants from Lithuania by Median Earnings
In terms of median earnings, the demographic groups most similar to Immigrants from Europe are Australian ($52,294, a difference of 0.19%), Bhutanese ($52,297, a difference of 0.20%), Immigrants from Czechoslovakia ($52,361, a difference of 0.32%), Bolivian ($52,005, a difference of 0.37%), and Immigrants from Malaysia ($52,514, a difference of 0.61%). Similarly, the demographic groups most similar to Immigrants from Lithuania are Israeli ($52,937, a difference of 0.32%), Immigrants from Turkey ($52,960, a difference of 0.36%), Latvian ($53,001, a difference of 0.44%), Maltese ($52,526, a difference of 0.46%), and Immigrants from Malaysia ($52,514, a difference of 0.49%).
| Demographics | Rating | Rank | Median Earnings |
| Immigrants | Sri Lanka | 100.0 /100 | #34 | Exceptional $53,268 |
| Immigrants | Switzerland | 100.0 /100 | #35 | Exceptional $53,211 |
| Immigrants | Denmark | 100.0 /100 | #36 | Exceptional $53,186 |
| Immigrants | Belarus | 100.0 /100 | #37 | Exceptional $53,043 |
| Latvians | 100.0 /100 | #38 | Exceptional $53,001 |
| Immigrants | Turkey | 100.0 /100 | #39 | Exceptional $52,960 |
| Israelis | 100.0 /100 | #40 | Exceptional $52,937 |
| Immigrants | Lithuania | 100.0 /100 | #41 | Exceptional $52,769 |
| Maltese | 100.0 /100 | #42 | Exceptional $52,526 |
| Immigrants | Malaysia | 100.0 /100 | #43 | Exceptional $52,514 |
| Bulgarians | 100.0 /100 | #44 | Exceptional $52,512 |
| Immigrants | Czechoslovakia | 100.0 /100 | #45 | Exceptional $52,361 |
| Bhutanese | 100.0 /100 | #46 | Exceptional $52,297 |
| Australians | 100.0 /100 | #47 | Exceptional $52,294 |
| Immigrants | Europe | 100.0 /100 | #48 | Exceptional $52,195 |
| Bolivians | 100.0 /100 | #49 | Exceptional $52,005 |
| Immigrants | South Africa | 100.0 /100 | #50 | Exceptional $51,850 |
| Immigrants | Austria | 99.9 /100 | #51 | Exceptional $51,826 |
| Estonians | 99.9 /100 | #52 | Exceptional $51,772 |
| Immigrants | Norway | 99.9 /100 | #53 | Exceptional $51,758 |
| Immigrants | Indonesia | 99.9 /100 | #54 | Exceptional $51,715 |