Immigrants from Ethiopia vs Immigrants from Laos Median Earnings
COMPARE
Immigrants from Ethiopia
Immigrants from Laos
Median Earnings
Median Earnings Comparison
Immigrants from Ethiopia
Immigrants from Laos
$48,924
MEDIAN EARNINGS
97.1/ 100
METRIC RATING
110th/ 347
METRIC RANK
$42,884
MEDIAN EARNINGS
0.7/ 100
METRIC RATING
266th/ 347
METRIC RANK
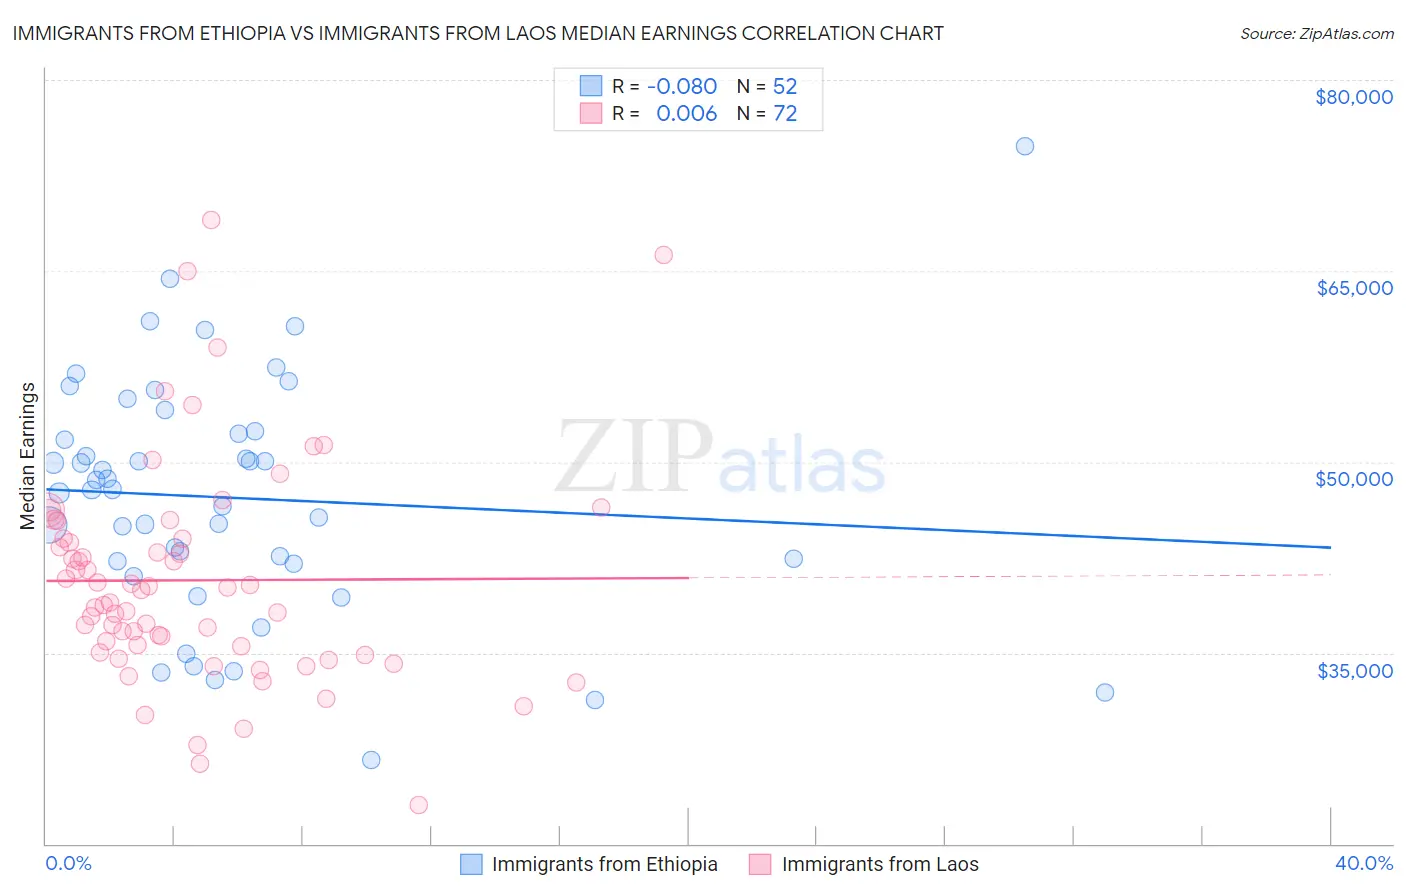
Immigrants from Ethiopia vs Immigrants from Laos Median Earnings Correlation Chart
The statistical analysis conducted on geographies consisting of 211,566,238 people shows a slight negative correlation between the proportion of Immigrants from Ethiopia and median earnings in the United States with a correlation coefficient (R) of -0.080 and weighted average of $48,924. Similarly, the statistical analysis conducted on geographies consisting of 201,460,807 people shows no correlation between the proportion of Immigrants from Laos and median earnings in the United States with a correlation coefficient (R) of 0.006 and weighted average of $42,884, a difference of 14.1%.
Median Earnings Correlation Summary
| Measurement | Immigrants from Ethiopia | Immigrants from Laos |
| Minimum | $26,567 | $23,015 |
| Maximum | $74,844 | $69,036 |
| Range | $48,277 | $46,021 |
| Mean | $47,171 | $40,698 |
| Median | $47,805 | $39,398 |
| Interquartile 25% (IQ1) | $42,088 | $35,289 |
| Interquartile 75% (IQ3) | $52,349 | $43,967 |
| Interquartile Range (IQR) | $10,261 | $8,679 |
| Standard Deviation (Sample) | $9,417 | $8,643 |
| Standard Deviation (Population) | $9,326 | $8,583 |
Similar Demographics by Median Earnings
Demographics Similar to Immigrants from Ethiopia by Median Earnings
In terms of median earnings, the demographic groups most similar to Immigrants from Ethiopia are Syrian ($48,934, a difference of 0.020%), Immigrants from Zimbabwe ($48,913, a difference of 0.020%), Northern European ($48,887, a difference of 0.070%), Immigrants from Kuwait ($48,861, a difference of 0.13%), and Moroccan ($48,838, a difference of 0.17%).
| Demographics | Rating | Rank | Median Earnings |
| Austrians | 98.7 /100 | #103 | Exceptional $49,501 |
| Immigrants | Brazil | 98.6 /100 | #104 | Exceptional $49,463 |
| Immigrants | Western Asia | 98.4 /100 | #105 | Exceptional $49,389 |
| Immigrants | Albania | 98.4 /100 | #106 | Exceptional $49,377 |
| Immigrants | Morocco | 98.4 /100 | #107 | Exceptional $49,368 |
| Palestinians | 98.0 /100 | #108 | Exceptional $49,209 |
| Syrians | 97.1 /100 | #109 | Exceptional $48,934 |
| Immigrants | Ethiopia | 97.1 /100 | #110 | Exceptional $48,924 |
| Immigrants | Zimbabwe | 97.0 /100 | #111 | Exceptional $48,913 |
| Northern Europeans | 96.9 /100 | #112 | Exceptional $48,887 |
| Immigrants | Kuwait | 96.8 /100 | #113 | Exceptional $48,861 |
| Moroccans | 96.7 /100 | #114 | Exceptional $48,838 |
| Chinese | 96.7 /100 | #115 | Exceptional $48,836 |
| Koreans | 96.2 /100 | #116 | Exceptional $48,727 |
| Serbians | 95.9 /100 | #117 | Exceptional $48,677 |
Demographics Similar to Immigrants from Laos by Median Earnings
In terms of median earnings, the demographic groups most similar to Immigrants from Laos are Salvadoran ($42,912, a difference of 0.060%), Immigrants from Liberia ($42,923, a difference of 0.090%), Cree ($42,777, a difference of 0.25%), Inupiat ($43,000, a difference of 0.27%), and Immigrants from Jamaica ($43,026, a difference of 0.33%).
| Demographics | Rating | Rank | Median Earnings |
| German Russians | 1.1 /100 | #259 | Tragic $43,200 |
| Immigrants | Somalia | 0.9 /100 | #260 | Tragic $43,100 |
| Immigrants | Jamaica | 0.8 /100 | #261 | Tragic $43,026 |
| Nicaraguans | 0.8 /100 | #262 | Tragic $43,026 |
| Inupiat | 0.8 /100 | #263 | Tragic $43,000 |
| Immigrants | Liberia | 0.7 /100 | #264 | Tragic $42,923 |
| Salvadorans | 0.7 /100 | #265 | Tragic $42,912 |
| Immigrants | Laos | 0.7 /100 | #266 | Tragic $42,884 |
| Cree | 0.6 /100 | #267 | Tragic $42,777 |
| Americans | 0.6 /100 | #268 | Tragic $42,742 |
| Belizeans | 0.5 /100 | #269 | Tragic $42,702 |
| Osage | 0.5 /100 | #270 | Tragic $42,651 |
| Pennsylvania Germans | 0.5 /100 | #271 | Tragic $42,615 |
| Iroquois | 0.4 /100 | #272 | Tragic $42,430 |
| Immigrants | Dominica | 0.4 /100 | #273 | Tragic $42,420 |