Immigrants from Ethiopia vs Spaniard Median Earnings
COMPARE
Immigrants from Ethiopia
Spaniard
Median Earnings
Median Earnings Comparison
Immigrants from Ethiopia
Spaniards
$48,924
MEDIAN EARNINGS
97.1/ 100
METRIC RATING
110th/ 347
METRIC RANK
$46,059
MEDIAN EARNINGS
37.2/ 100
METRIC RATING
189th/ 347
METRIC RANK
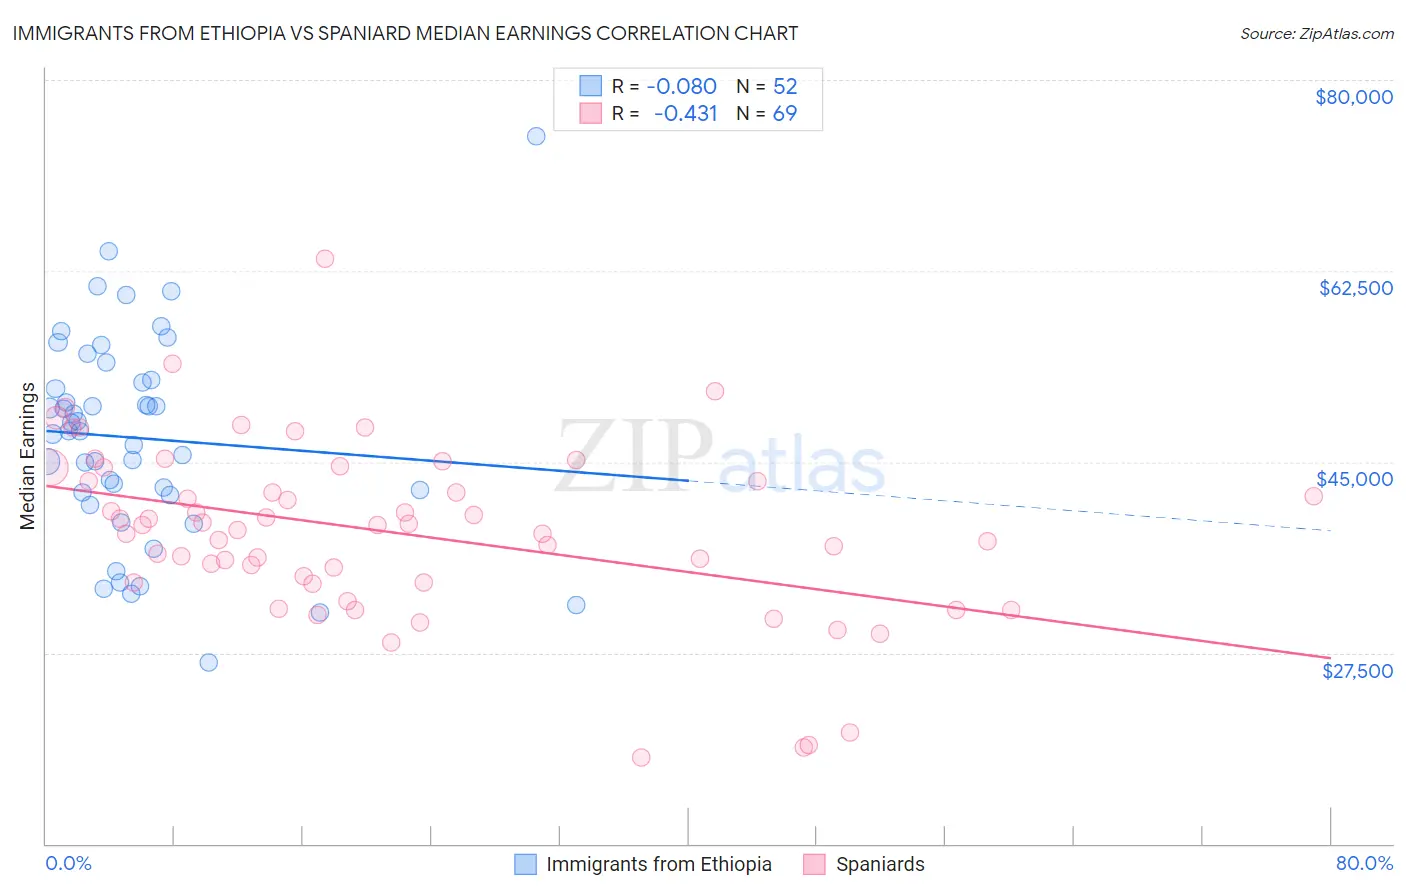
Immigrants from Ethiopia vs Spaniard Median Earnings Correlation Chart
The statistical analysis conducted on geographies consisting of 211,566,238 people shows a slight negative correlation between the proportion of Immigrants from Ethiopia and median earnings in the United States with a correlation coefficient (R) of -0.080 and weighted average of $48,924. Similarly, the statistical analysis conducted on geographies consisting of 443,499,083 people shows a moderate negative correlation between the proportion of Spaniards and median earnings in the United States with a correlation coefficient (R) of -0.431 and weighted average of $46,059, a difference of 6.2%.
Median Earnings Correlation Summary
| Measurement | Immigrants from Ethiopia | Spaniard |
| Minimum | $26,567 | $17,955 |
| Maximum | $74,844 | $63,593 |
| Range | $48,277 | $45,638 |
| Mean | $47,171 | $38,549 |
| Median | $47,805 | $39,160 |
| Interquartile 25% (IQ1) | $42,088 | $33,928 |
| Interquartile 75% (IQ3) | $52,349 | $43,838 |
| Interquartile Range (IQR) | $10,261 | $9,909 |
| Standard Deviation (Sample) | $9,417 | $8,136 |
| Standard Deviation (Population) | $9,326 | $8,076 |
Similar Demographics by Median Earnings
Demographics Similar to Immigrants from Ethiopia by Median Earnings
In terms of median earnings, the demographic groups most similar to Immigrants from Ethiopia are Syrian ($48,934, a difference of 0.020%), Immigrants from Zimbabwe ($48,913, a difference of 0.020%), Northern European ($48,887, a difference of 0.070%), Immigrants from Kuwait ($48,861, a difference of 0.13%), and Moroccan ($48,838, a difference of 0.17%).
| Demographics | Rating | Rank | Median Earnings |
| Austrians | 98.7 /100 | #103 | Exceptional $49,501 |
| Immigrants | Brazil | 98.6 /100 | #104 | Exceptional $49,463 |
| Immigrants | Western Asia | 98.4 /100 | #105 | Exceptional $49,389 |
| Immigrants | Albania | 98.4 /100 | #106 | Exceptional $49,377 |
| Immigrants | Morocco | 98.4 /100 | #107 | Exceptional $49,368 |
| Palestinians | 98.0 /100 | #108 | Exceptional $49,209 |
| Syrians | 97.1 /100 | #109 | Exceptional $48,934 |
| Immigrants | Ethiopia | 97.1 /100 | #110 | Exceptional $48,924 |
| Immigrants | Zimbabwe | 97.0 /100 | #111 | Exceptional $48,913 |
| Northern Europeans | 96.9 /100 | #112 | Exceptional $48,887 |
| Immigrants | Kuwait | 96.8 /100 | #113 | Exceptional $48,861 |
| Moroccans | 96.7 /100 | #114 | Exceptional $48,838 |
| Chinese | 96.7 /100 | #115 | Exceptional $48,836 |
| Koreans | 96.2 /100 | #116 | Exceptional $48,727 |
| Serbians | 95.9 /100 | #117 | Exceptional $48,677 |
Demographics Similar to Spaniards by Median Earnings
In terms of median earnings, the demographic groups most similar to Spaniards are French Canadian ($46,026, a difference of 0.070%), Immigrants from Armenia ($46,094, a difference of 0.080%), Iraqi ($46,140, a difference of 0.18%), Vietnamese ($46,172, a difference of 0.24%), and Finnish ($45,940, a difference of 0.26%).
| Demographics | Rating | Rank | Median Earnings |
| Swiss | 45.9 /100 | #182 | Average $46,315 |
| French | 45.2 /100 | #183 | Average $46,296 |
| Immigrants | Kenya | 42.4 /100 | #184 | Average $46,214 |
| Uruguayans | 41.6 /100 | #185 | Average $46,190 |
| Vietnamese | 40.9 /100 | #186 | Average $46,172 |
| Iraqis | 39.9 /100 | #187 | Fair $46,140 |
| Immigrants | Armenia | 38.3 /100 | #188 | Fair $46,094 |
| Spaniards | 37.2 /100 | #189 | Fair $46,059 |
| French Canadians | 36.1 /100 | #190 | Fair $46,026 |
| Finns | 33.4 /100 | #191 | Fair $45,940 |
| Germans | 33.2 /100 | #192 | Fair $45,935 |
| Guamanians/Chamorros | 33.2 /100 | #193 | Fair $45,933 |
| Immigrants | Costa Rica | 33.0 /100 | #194 | Fair $45,928 |
| Immigrants | St. Vincent and the Grenadines | 32.4 /100 | #195 | Fair $45,908 |
| Yugoslavians | 30.5 /100 | #196 | Fair $45,846 |