Immigrants from Ethiopia vs Scottish Median Earnings
COMPARE
Immigrants from Ethiopia
Scottish
Median Earnings
Median Earnings Comparison
Immigrants from Ethiopia
Scottish
$48,924
MEDIAN EARNINGS
97.1/ 100
METRIC RATING
110th/ 347
METRIC RANK
$46,463
MEDIAN EARNINGS
51.1/ 100
METRIC RATING
171st/ 347
METRIC RANK
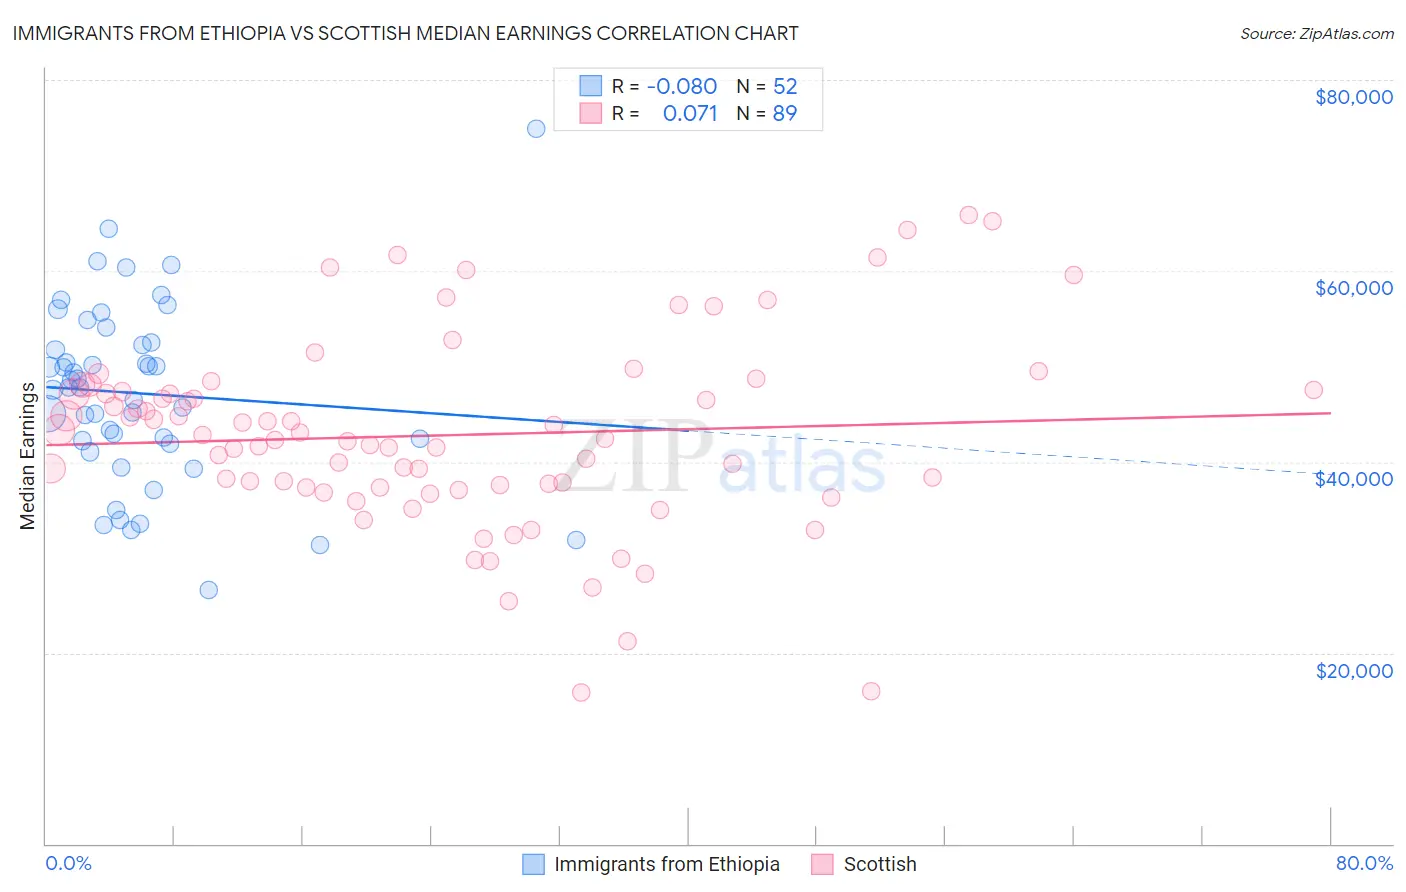
Immigrants from Ethiopia vs Scottish Median Earnings Correlation Chart
The statistical analysis conducted on geographies consisting of 211,566,238 people shows a slight negative correlation between the proportion of Immigrants from Ethiopia and median earnings in the United States with a correlation coefficient (R) of -0.080 and weighted average of $48,924. Similarly, the statistical analysis conducted on geographies consisting of 566,727,136 people shows a slight positive correlation between the proportion of Scottish and median earnings in the United States with a correlation coefficient (R) of 0.071 and weighted average of $46,463, a difference of 5.3%.
Median Earnings Correlation Summary
| Measurement | Immigrants from Ethiopia | Scottish |
| Minimum | $26,567 | $15,833 |
| Maximum | $74,844 | $65,898 |
| Range | $48,277 | $50,065 |
| Mean | $47,171 | $42,786 |
| Median | $47,805 | $42,413 |
| Interquartile 25% (IQ1) | $42,088 | $37,295 |
| Interquartile 75% (IQ3) | $52,349 | $47,447 |
| Interquartile Range (IQR) | $10,261 | $10,152 |
| Standard Deviation (Sample) | $9,417 | $10,003 |
| Standard Deviation (Population) | $9,326 | $9,946 |
Similar Demographics by Median Earnings
Demographics Similar to Immigrants from Ethiopia by Median Earnings
In terms of median earnings, the demographic groups most similar to Immigrants from Ethiopia are Syrian ($48,934, a difference of 0.020%), Immigrants from Zimbabwe ($48,913, a difference of 0.020%), Northern European ($48,887, a difference of 0.070%), Immigrants from Kuwait ($48,861, a difference of 0.13%), and Moroccan ($48,838, a difference of 0.17%).
| Demographics | Rating | Rank | Median Earnings |
| Austrians | 98.7 /100 | #103 | Exceptional $49,501 |
| Immigrants | Brazil | 98.6 /100 | #104 | Exceptional $49,463 |
| Immigrants | Western Asia | 98.4 /100 | #105 | Exceptional $49,389 |
| Immigrants | Albania | 98.4 /100 | #106 | Exceptional $49,377 |
| Immigrants | Morocco | 98.4 /100 | #107 | Exceptional $49,368 |
| Palestinians | 98.0 /100 | #108 | Exceptional $49,209 |
| Syrians | 97.1 /100 | #109 | Exceptional $48,934 |
| Immigrants | Ethiopia | 97.1 /100 | #110 | Exceptional $48,924 |
| Immigrants | Zimbabwe | 97.0 /100 | #111 | Exceptional $48,913 |
| Northern Europeans | 96.9 /100 | #112 | Exceptional $48,887 |
| Immigrants | Kuwait | 96.8 /100 | #113 | Exceptional $48,861 |
| Moroccans | 96.7 /100 | #114 | Exceptional $48,838 |
| Chinese | 96.7 /100 | #115 | Exceptional $48,836 |
| Koreans | 96.2 /100 | #116 | Exceptional $48,727 |
| Serbians | 95.9 /100 | #117 | Exceptional $48,677 |
Demographics Similar to Scottish by Median Earnings
In terms of median earnings, the demographic groups most similar to Scottish are Kenyan ($46,462, a difference of 0.0%), Immigrants ($46,478, a difference of 0.030%), Ghanaian ($46,440, a difference of 0.050%), Scandinavian ($46,433, a difference of 0.060%), and Basque ($46,399, a difference of 0.14%).
| Demographics | Rating | Rank | Median Earnings |
| Norwegians | 64.7 /100 | #164 | Good $46,865 |
| South Americans | 62.7 /100 | #165 | Good $46,804 |
| Czechoslovakians | 57.8 /100 | #166 | Average $46,658 |
| Costa Ricans | 57.4 /100 | #167 | Average $46,645 |
| Immigrants | Africa | 54.6 /100 | #168 | Average $46,564 |
| Immigrants | South America | 54.0 /100 | #169 | Average $46,548 |
| Immigrants | Immigrants | 51.6 /100 | #170 | Average $46,478 |
| Scottish | 51.1 /100 | #171 | Average $46,463 |
| Kenyans | 51.0 /100 | #172 | Average $46,462 |
| Ghanaians | 50.3 /100 | #173 | Average $46,440 |
| Scandinavians | 50.0 /100 | #174 | Average $46,433 |
| Basques | 48.8 /100 | #175 | Average $46,399 |
| Danes | 48.6 /100 | #176 | Average $46,392 |
| Belgians | 48.0 /100 | #177 | Average $46,375 |
| Colombians | 47.1 /100 | #178 | Average $46,349 |