Immigrants from England vs Immigrants from Burma/Myanmar In Labor Force | Age 35-44
COMPARE
Immigrants from England
Immigrants from Burma/Myanmar
In Labor Force | Age 35-44
In Labor Force | Age 35-44 Comparison
Immigrants from England
Immigrants from Burma/Myanmar
84.2%
IN LABOR FORCE | AGE 35-44
25.0/ 100
METRIC RATING
196th/ 347
METRIC RANK
84.0%
IN LABOR FORCE | AGE 35-44
6.1/ 100
METRIC RATING
225th/ 347
METRIC RANK
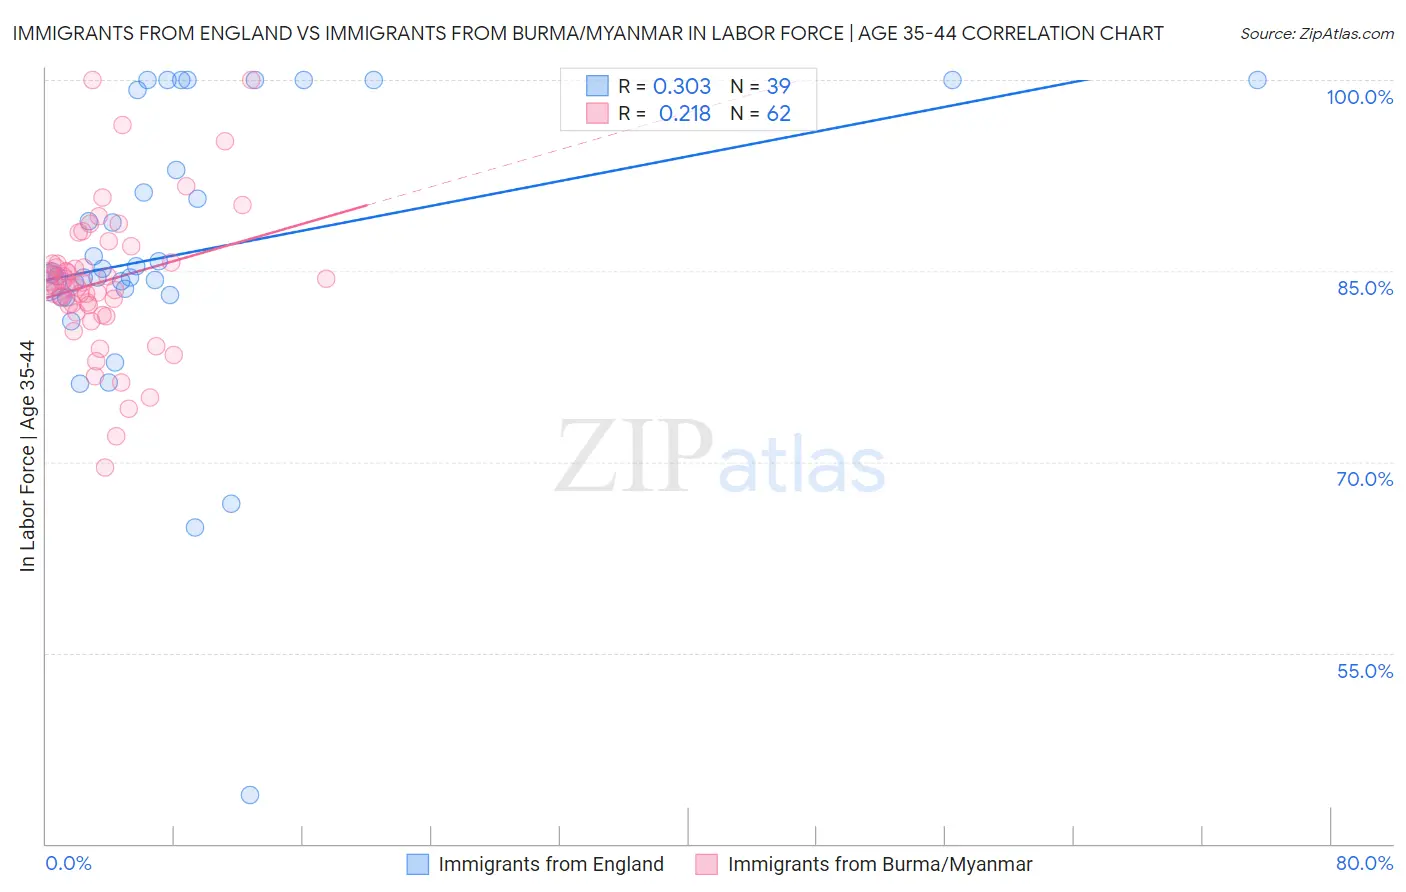
Immigrants from England vs Immigrants from Burma/Myanmar In Labor Force | Age 35-44 Correlation Chart
The statistical analysis conducted on geographies consisting of 391,745,799 people shows a mild positive correlation between the proportion of Immigrants from England and labor force participation rate among population between the ages 35 and 44 in the United States with a correlation coefficient (R) of 0.303 and weighted average of 84.2%. Similarly, the statistical analysis conducted on geographies consisting of 172,270,832 people shows a weak positive correlation between the proportion of Immigrants from Burma/Myanmar and labor force participation rate among population between the ages 35 and 44 in the United States with a correlation coefficient (R) of 0.218 and weighted average of 84.0%, a difference of 0.27%.
In Labor Force | Age 35-44 Correlation Summary
| Measurement | Immigrants from England | Immigrants from Burma/Myanmar |
| Minimum | 43.8% | 69.6% |
| Maximum | 100.0% | 100.0% |
| Range | 56.2% | 30.4% |
| Mean | 86.5% | 84.2% |
| Median | 84.9% | 84.1% |
| Interquartile 25% (IQ1) | 83.2% | 82.3% |
| Interquartile 75% (IQ3) | 99.3% | 85.6% |
| Interquartile Range (IQR) | 16.1% | 3.3% |
| Standard Deviation (Sample) | 11.5% | 5.6% |
| Standard Deviation (Population) | 11.3% | 5.5% |
Similar Demographics by In Labor Force | Age 35-44
Demographics Similar to Immigrants from England by In Labor Force | Age 35-44
In terms of in labor force | age 35-44, the demographic groups most similar to Immigrants from England are Immigrants from Western Europe (84.2%, a difference of 0.0%), Hungarian (84.2%, a difference of 0.010%), Immigrants from Indonesia (84.2%, a difference of 0.010%), Immigrants from Caribbean (84.2%, a difference of 0.010%), and Ecuadorian (84.2%, a difference of 0.010%).
| Demographics | Rating | Rank | In Labor Force | Age 35-44 |
| Immigrants | Denmark | 33.7 /100 | #189 | Fair 84.3% |
| Portuguese | 31.9 /100 | #190 | Fair 84.3% |
| Immigrants | Philippines | 27.9 /100 | #191 | Fair 84.2% |
| Immigrants | Vietnam | 27.4 /100 | #192 | Fair 84.2% |
| Hungarians | 26.8 /100 | #193 | Fair 84.2% |
| Immigrants | Indonesia | 25.7 /100 | #194 | Fair 84.2% |
| Immigrants | Caribbean | 25.7 /100 | #195 | Fair 84.2% |
| Immigrants | England | 25.0 /100 | #196 | Fair 84.2% |
| Immigrants | Western Europe | 24.7 /100 | #197 | Fair 84.2% |
| Ecuadorians | 24.0 /100 | #198 | Fair 84.2% |
| Syrians | 23.2 /100 | #199 | Fair 84.2% |
| Moroccans | 23.2 /100 | #200 | Fair 84.2% |
| British | 23.0 /100 | #201 | Fair 84.2% |
| Immigrants | Uzbekistan | 22.8 /100 | #202 | Fair 84.2% |
| Immigrants | South Eastern Asia | 22.4 /100 | #203 | Fair 84.2% |
Demographics Similar to Immigrants from Burma/Myanmar by In Labor Force | Age 35-44
In terms of in labor force | age 35-44, the demographic groups most similar to Immigrants from Burma/Myanmar are U.S. Virgin Islander (84.0%, a difference of 0.0%), Assyrian/Chaldean/Syriac (84.0%, a difference of 0.010%), Immigrants from Panama (84.0%, a difference of 0.010%), Icelander (84.0%, a difference of 0.020%), and Panamanian (84.0%, a difference of 0.020%).
| Demographics | Rating | Rank | In Labor Force | Age 35-44 |
| Immigrants | Nicaragua | 9.4 /100 | #218 | Tragic 84.1% |
| Sub-Saharan Africans | 9.3 /100 | #219 | Tragic 84.1% |
| French | 7.5 /100 | #220 | Tragic 84.0% |
| Icelanders | 6.7 /100 | #221 | Tragic 84.0% |
| Assyrians/Chaldeans/Syriacs | 6.6 /100 | #222 | Tragic 84.0% |
| Immigrants | Panama | 6.4 /100 | #223 | Tragic 84.0% |
| U.S. Virgin Islanders | 6.1 /100 | #224 | Tragic 84.0% |
| Immigrants | Burma/Myanmar | 6.1 /100 | #225 | Tragic 84.0% |
| Panamanians | 5.4 /100 | #226 | Tragic 84.0% |
| British West Indians | 5.3 /100 | #227 | Tragic 84.0% |
| Welsh | 5.3 /100 | #228 | Tragic 84.0% |
| Immigrants | Thailand | 4.7 /100 | #229 | Tragic 84.0% |
| Immigrants | Iraq | 3.7 /100 | #230 | Tragic 83.9% |
| Scottish | 3.2 /100 | #231 | Tragic 83.9% |
| Native Hawaiians | 3.0 /100 | #232 | Tragic 83.9% |