Immigrants from England vs Immigrants from Congo Median Earnings
COMPARE
Immigrants from England
Immigrants from Congo
Median Earnings
Median Earnings Comparison
Immigrants from England
Immigrants from Congo
$49,722
MEDIAN EARNINGS
99.0/ 100
METRIC RATING
95th/ 347
METRIC RANK
$39,169
MEDIAN EARNINGS
0.0/ 100
METRIC RATING
330th/ 347
METRIC RANK
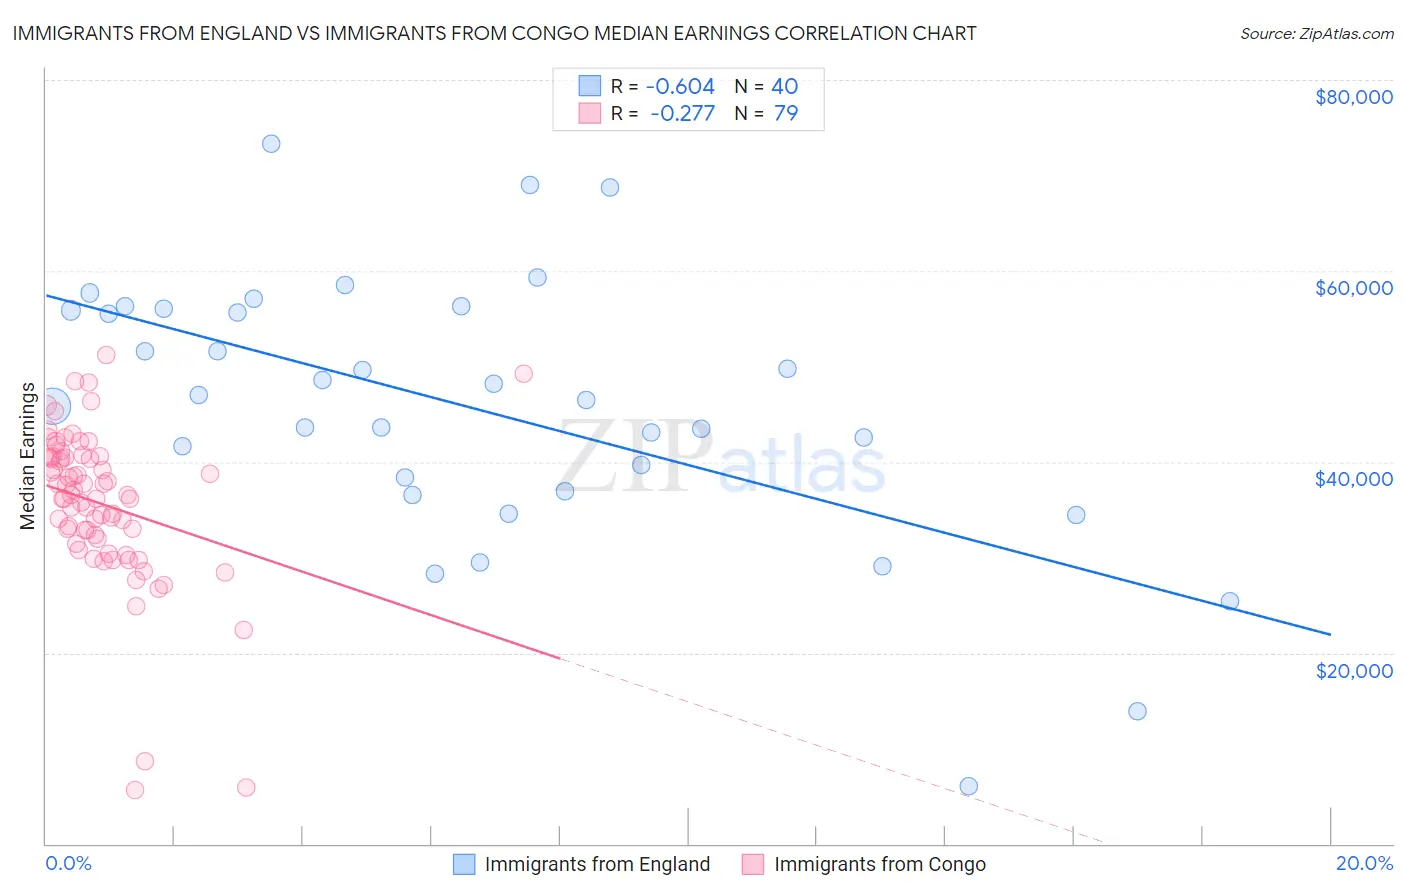
Immigrants from England vs Immigrants from Congo Median Earnings Correlation Chart
The statistical analysis conducted on geographies consisting of 391,848,083 people shows a significant negative correlation between the proportion of Immigrants from England and median earnings in the United States with a correlation coefficient (R) of -0.604 and weighted average of $49,722. Similarly, the statistical analysis conducted on geographies consisting of 92,120,169 people shows a weak negative correlation between the proportion of Immigrants from Congo and median earnings in the United States with a correlation coefficient (R) of -0.277 and weighted average of $39,169, a difference of 26.9%.
Median Earnings Correlation Summary
| Measurement | Immigrants from England | Immigrants from Congo |
| Minimum | $5,997 | $5,625 |
| Maximum | $73,280 | $51,158 |
| Range | $67,283 | $45,533 |
| Mean | $45,709 | $35,599 |
| Median | $46,726 | $36,543 |
| Interquartile 25% (IQ1) | $37,678 | $31,963 |
| Interquartile 75% (IQ3) | $55,979 | $40,520 |
| Interquartile Range (IQR) | $18,301 | $8,557 |
| Standard Deviation (Sample) | $13,949 | $8,202 |
| Standard Deviation (Population) | $13,773 | $8,150 |
Similar Demographics by Median Earnings
Demographics Similar to Immigrants from England by Median Earnings
In terms of median earnings, the demographic groups most similar to Immigrants from England are Croatian ($49,724, a difference of 0.0%), Immigrants from Lebanon ($49,682, a difference of 0.080%), Immigrants from North Macedonia ($49,658, a difference of 0.13%), Immigrants from Northern Africa ($49,648, a difference of 0.15%), and Armenian ($49,804, a difference of 0.16%).
| Demographics | Rating | Rank | Median Earnings |
| Albanians | 99.4 /100 | #88 | Exceptional $50,116 |
| Immigrants | North America | 99.4 /100 | #89 | Exceptional $50,108 |
| Italians | 99.3 /100 | #90 | Exceptional $49,915 |
| Macedonians | 99.2 /100 | #91 | Exceptional $49,893 |
| Immigrants | Argentina | 99.2 /100 | #92 | Exceptional $49,841 |
| Armenians | 99.1 /100 | #93 | Exceptional $49,804 |
| Croatians | 99.0 /100 | #94 | Exceptional $49,724 |
| Immigrants | England | 99.0 /100 | #95 | Exceptional $49,722 |
| Immigrants | Lebanon | 99.0 /100 | #96 | Exceptional $49,682 |
| Immigrants | North Macedonia | 98.9 /100 | #97 | Exceptional $49,658 |
| Immigrants | Northern Africa | 98.9 /100 | #98 | Exceptional $49,648 |
| Immigrants | Afghanistan | 98.9 /100 | #99 | Exceptional $49,645 |
| Immigrants | Poland | 98.9 /100 | #100 | Exceptional $49,633 |
| Jordanians | 98.9 /100 | #101 | Exceptional $49,632 |
| Ethiopians | 98.8 /100 | #102 | Exceptional $49,572 |
Demographics Similar to Immigrants from Congo by Median Earnings
In terms of median earnings, the demographic groups most similar to Immigrants from Congo are Immigrants from Mexico ($39,114, a difference of 0.14%), Kiowa ($39,232, a difference of 0.16%), Yakama ($39,107, a difference of 0.16%), Houma ($38,949, a difference of 0.57%), and Spanish American Indian ($38,907, a difference of 0.67%).
| Demographics | Rating | Rank | Median Earnings |
| Bahamians | 0.0 /100 | #323 | Tragic $39,735 |
| Ottawa | 0.0 /100 | #324 | Tragic $39,721 |
| Creek | 0.0 /100 | #325 | Tragic $39,648 |
| Immigrants | Yemen | 0.0 /100 | #326 | Tragic $39,540 |
| Yuman | 0.0 /100 | #327 | Tragic $39,523 |
| Sioux | 0.0 /100 | #328 | Tragic $39,448 |
| Kiowa | 0.0 /100 | #329 | Tragic $39,232 |
| Immigrants | Congo | 0.0 /100 | #330 | Tragic $39,169 |
| Immigrants | Mexico | 0.0 /100 | #331 | Tragic $39,114 |
| Yakama | 0.0 /100 | #332 | Tragic $39,107 |
| Houma | 0.0 /100 | #333 | Tragic $38,949 |
| Spanish American Indians | 0.0 /100 | #334 | Tragic $38,907 |
| Natives/Alaskans | 0.0 /100 | #335 | Tragic $38,896 |
| Crow | 0.0 /100 | #336 | Tragic $38,707 |
| Immigrants | Cuba | 0.0 /100 | #337 | Tragic $38,426 |