Immigrants from England vs Czechoslovakian Median Earnings
COMPARE
Immigrants from England
Czechoslovakian
Median Earnings
Median Earnings Comparison
Immigrants from England
Czechoslovakians
$49,722
MEDIAN EARNINGS
99.0/ 100
METRIC RATING
95th/ 347
METRIC RANK
$46,658
MEDIAN EARNINGS
57.8/ 100
METRIC RATING
166th/ 347
METRIC RANK
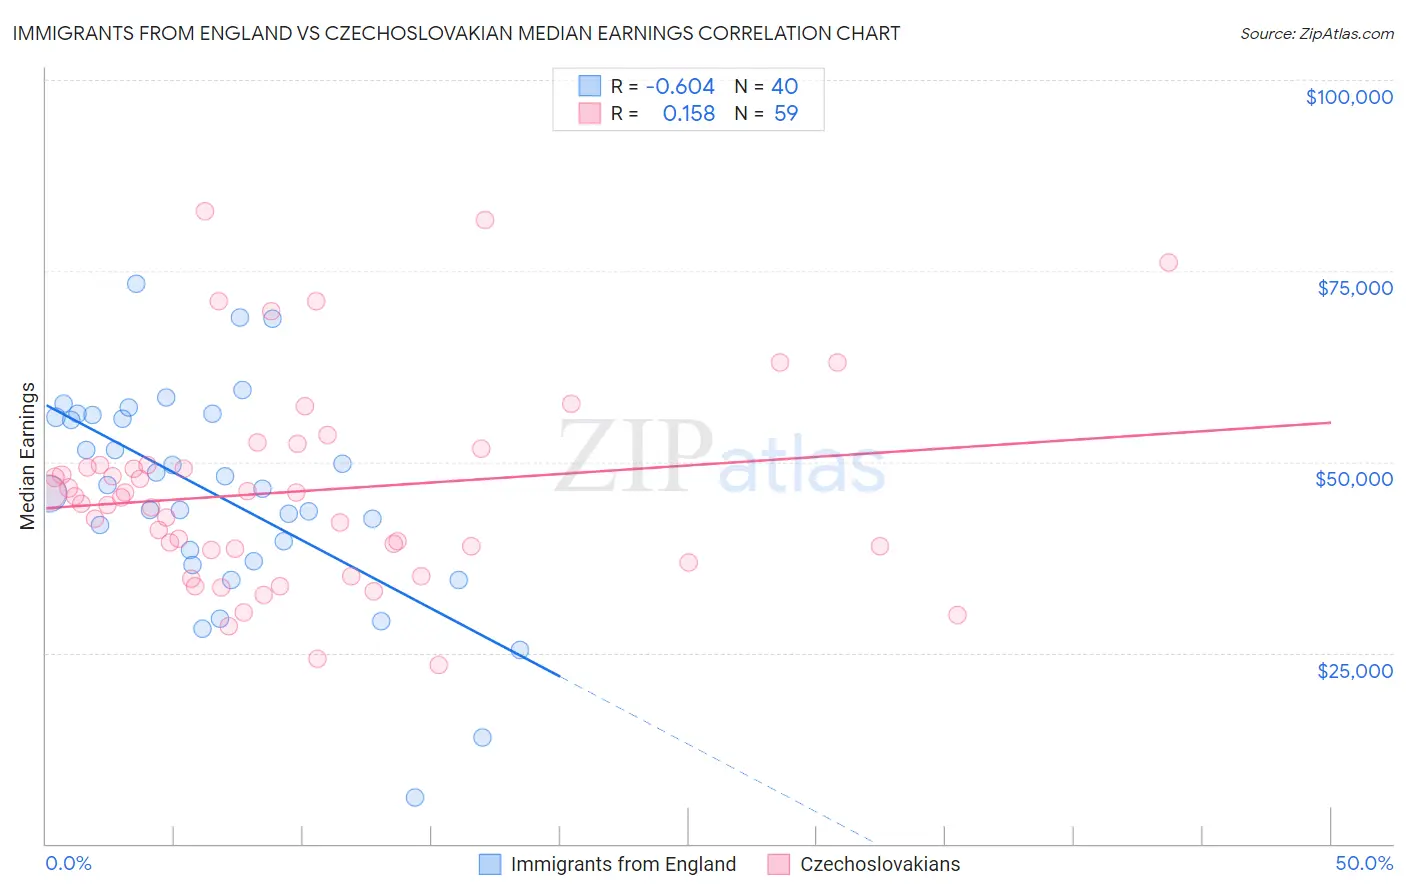
Immigrants from England vs Czechoslovakian Median Earnings Correlation Chart
The statistical analysis conducted on geographies consisting of 391,848,083 people shows a significant negative correlation between the proportion of Immigrants from England and median earnings in the United States with a correlation coefficient (R) of -0.604 and weighted average of $49,722. Similarly, the statistical analysis conducted on geographies consisting of 368,633,648 people shows a poor positive correlation between the proportion of Czechoslovakians and median earnings in the United States with a correlation coefficient (R) of 0.158 and weighted average of $46,658, a difference of 6.6%.
Median Earnings Correlation Summary
| Measurement | Immigrants from England | Czechoslovakian |
| Minimum | $5,997 | $23,333 |
| Maximum | $73,280 | $82,793 |
| Range | $67,283 | $59,460 |
| Mean | $45,709 | $46,151 |
| Median | $46,726 | $45,298 |
| Interquartile 25% (IQ1) | $37,678 | $38,524 |
| Interquartile 75% (IQ3) | $55,979 | $49,625 |
| Interquartile Range (IQR) | $18,301 | $11,101 |
| Standard Deviation (Sample) | $13,949 | $13,082 |
| Standard Deviation (Population) | $13,773 | $12,971 |
Similar Demographics by Median Earnings
Demographics Similar to Immigrants from England by Median Earnings
In terms of median earnings, the demographic groups most similar to Immigrants from England are Croatian ($49,724, a difference of 0.0%), Immigrants from Lebanon ($49,682, a difference of 0.080%), Immigrants from North Macedonia ($49,658, a difference of 0.13%), Immigrants from Northern Africa ($49,648, a difference of 0.15%), and Armenian ($49,804, a difference of 0.16%).
| Demographics | Rating | Rank | Median Earnings |
| Albanians | 99.4 /100 | #88 | Exceptional $50,116 |
| Immigrants | North America | 99.4 /100 | #89 | Exceptional $50,108 |
| Italians | 99.3 /100 | #90 | Exceptional $49,915 |
| Macedonians | 99.2 /100 | #91 | Exceptional $49,893 |
| Immigrants | Argentina | 99.2 /100 | #92 | Exceptional $49,841 |
| Armenians | 99.1 /100 | #93 | Exceptional $49,804 |
| Croatians | 99.0 /100 | #94 | Exceptional $49,724 |
| Immigrants | England | 99.0 /100 | #95 | Exceptional $49,722 |
| Immigrants | Lebanon | 99.0 /100 | #96 | Exceptional $49,682 |
| Immigrants | North Macedonia | 98.9 /100 | #97 | Exceptional $49,658 |
| Immigrants | Northern Africa | 98.9 /100 | #98 | Exceptional $49,648 |
| Immigrants | Afghanistan | 98.9 /100 | #99 | Exceptional $49,645 |
| Immigrants | Poland | 98.9 /100 | #100 | Exceptional $49,633 |
| Jordanians | 98.9 /100 | #101 | Exceptional $49,632 |
| Ethiopians | 98.8 /100 | #102 | Exceptional $49,572 |
Demographics Similar to Czechoslovakians by Median Earnings
In terms of median earnings, the demographic groups most similar to Czechoslovakians are Costa Rican ($46,645, a difference of 0.030%), Immigrants from Africa ($46,564, a difference of 0.20%), Immigrants from South America ($46,548, a difference of 0.24%), South American ($46,804, a difference of 0.31%), and Immigrants ($46,478, a difference of 0.39%).
| Demographics | Rating | Rank | Median Earnings |
| Immigrants | Peru | 69.6 /100 | #159 | Good $47,025 |
| Alsatians | 69.6 /100 | #160 | Good $47,023 |
| Immigrants | Eastern Africa | 68.0 /100 | #161 | Good $46,969 |
| South American Indians | 67.4 /100 | #162 | Good $46,952 |
| Icelanders | 66.3 /100 | #163 | Good $46,916 |
| Norwegians | 64.7 /100 | #164 | Good $46,865 |
| South Americans | 62.7 /100 | #165 | Good $46,804 |
| Czechoslovakians | 57.8 /100 | #166 | Average $46,658 |
| Costa Ricans | 57.4 /100 | #167 | Average $46,645 |
| Immigrants | Africa | 54.6 /100 | #168 | Average $46,564 |
| Immigrants | South America | 54.0 /100 | #169 | Average $46,548 |
| Immigrants | Immigrants | 51.6 /100 | #170 | Average $46,478 |
| Scottish | 51.1 /100 | #171 | Average $46,463 |
| Kenyans | 51.0 /100 | #172 | Average $46,462 |
| Ghanaians | 50.3 /100 | #173 | Average $46,440 |