Immigrants from England vs Immigrants from Chile Median Earnings
COMPARE
Immigrants from England
Immigrants from Chile
Median Earnings
Median Earnings Comparison
Immigrants from England
Immigrants from Chile
$49,722
MEDIAN EARNINGS
99.0/ 100
METRIC RATING
95th/ 347
METRIC RANK
$47,697
MEDIAN EARNINGS
85.5/ 100
METRIC RATING
146th/ 347
METRIC RANK
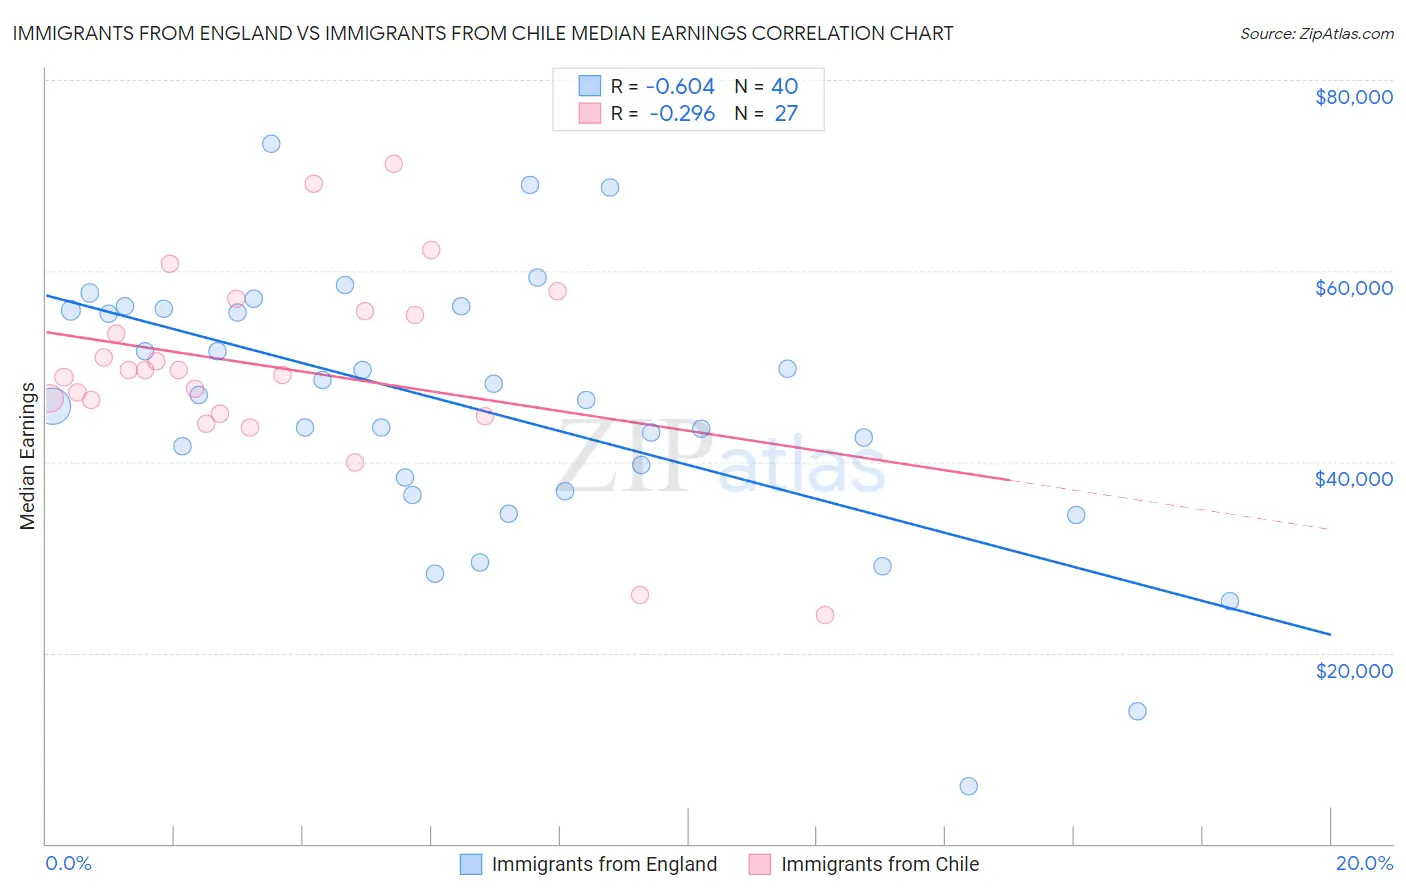
Immigrants from England vs Immigrants from Chile Median Earnings Correlation Chart
The statistical analysis conducted on geographies consisting of 391,848,083 people shows a significant negative correlation between the proportion of Immigrants from England and median earnings in the United States with a correlation coefficient (R) of -0.604 and weighted average of $49,722. Similarly, the statistical analysis conducted on geographies consisting of 218,645,469 people shows a weak negative correlation between the proportion of Immigrants from Chile and median earnings in the United States with a correlation coefficient (R) of -0.296 and weighted average of $47,697, a difference of 4.3%.
Median Earnings Correlation Summary
| Measurement | Immigrants from England | Immigrants from Chile |
| Minimum | $5,997 | $23,911 |
| Maximum | $73,280 | $71,250 |
| Range | $67,283 | $47,339 |
| Mean | $45,709 | $49,886 |
| Median | $46,726 | $49,642 |
| Interquartile 25% (IQ1) | $37,678 | $45,024 |
| Interquartile 75% (IQ3) | $55,979 | $55,791 |
| Interquartile Range (IQR) | $18,301 | $10,767 |
| Standard Deviation (Sample) | $13,949 | $10,356 |
| Standard Deviation (Population) | $13,773 | $10,162 |
Similar Demographics by Median Earnings
Demographics Similar to Immigrants from England by Median Earnings
In terms of median earnings, the demographic groups most similar to Immigrants from England are Croatian ($49,724, a difference of 0.0%), Immigrants from Lebanon ($49,682, a difference of 0.080%), Immigrants from North Macedonia ($49,658, a difference of 0.13%), Immigrants from Northern Africa ($49,648, a difference of 0.15%), and Armenian ($49,804, a difference of 0.16%).
| Demographics | Rating | Rank | Median Earnings |
| Albanians | 99.4 /100 | #88 | Exceptional $50,116 |
| Immigrants | North America | 99.4 /100 | #89 | Exceptional $50,108 |
| Italians | 99.3 /100 | #90 | Exceptional $49,915 |
| Macedonians | 99.2 /100 | #91 | Exceptional $49,893 |
| Immigrants | Argentina | 99.2 /100 | #92 | Exceptional $49,841 |
| Armenians | 99.1 /100 | #93 | Exceptional $49,804 |
| Croatians | 99.0 /100 | #94 | Exceptional $49,724 |
| Immigrants | England | 99.0 /100 | #95 | Exceptional $49,722 |
| Immigrants | Lebanon | 99.0 /100 | #96 | Exceptional $49,682 |
| Immigrants | North Macedonia | 98.9 /100 | #97 | Exceptional $49,658 |
| Immigrants | Northern Africa | 98.9 /100 | #98 | Exceptional $49,648 |
| Immigrants | Afghanistan | 98.9 /100 | #99 | Exceptional $49,645 |
| Immigrants | Poland | 98.9 /100 | #100 | Exceptional $49,633 |
| Jordanians | 98.9 /100 | #101 | Exceptional $49,632 |
| Ethiopians | 98.8 /100 | #102 | Exceptional $49,572 |
Demographics Similar to Immigrants from Chile by Median Earnings
In terms of median earnings, the demographic groups most similar to Immigrants from Chile are Immigrants from Saudi Arabia ($47,704, a difference of 0.010%), Immigrants from South Eastern Asia ($47,671, a difference of 0.060%), Immigrants from Eritrea ($47,657, a difference of 0.080%), Luxembourger ($47,640, a difference of 0.12%), and Peruvian ($47,628, a difference of 0.15%).
| Demographics | Rating | Rank | Median Earnings |
| Canadians | 88.8 /100 | #139 | Excellent $47,911 |
| Taiwanese | 88.7 /100 | #140 | Excellent $47,902 |
| Immigrants | Sierra Leone | 88.3 /100 | #141 | Excellent $47,875 |
| Ugandans | 88.0 /100 | #142 | Excellent $47,854 |
| Swedes | 88.0 /100 | #143 | Excellent $47,851 |
| Hungarians | 87.1 /100 | #144 | Excellent $47,795 |
| Immigrants | Saudi Arabia | 85.6 /100 | #145 | Excellent $47,704 |
| Immigrants | Chile | 85.5 /100 | #146 | Excellent $47,697 |
| Immigrants | South Eastern Asia | 85.0 /100 | #147 | Excellent $47,671 |
| Immigrants | Eritrea | 84.8 /100 | #148 | Excellent $47,657 |
| Luxembourgers | 84.5 /100 | #149 | Excellent $47,640 |
| Peruvians | 84.2 /100 | #150 | Excellent $47,628 |
| Immigrants | Oceania | 84.1 /100 | #151 | Excellent $47,617 |
| Immigrants | Germany | 83.1 /100 | #152 | Excellent $47,566 |
| Slavs | 81.1 /100 | #153 | Excellent $47,470 |