Immigrants from England vs Immigrants from Czechoslovakia Median Earnings
COMPARE
Immigrants from England
Immigrants from Czechoslovakia
Median Earnings
Median Earnings Comparison
Immigrants from England
Immigrants from Czechoslovakia
$49,722
MEDIAN EARNINGS
99.0/ 100
METRIC RATING
95th/ 347
METRIC RANK
$52,361
MEDIAN EARNINGS
100.0/ 100
METRIC RATING
45th/ 347
METRIC RANK
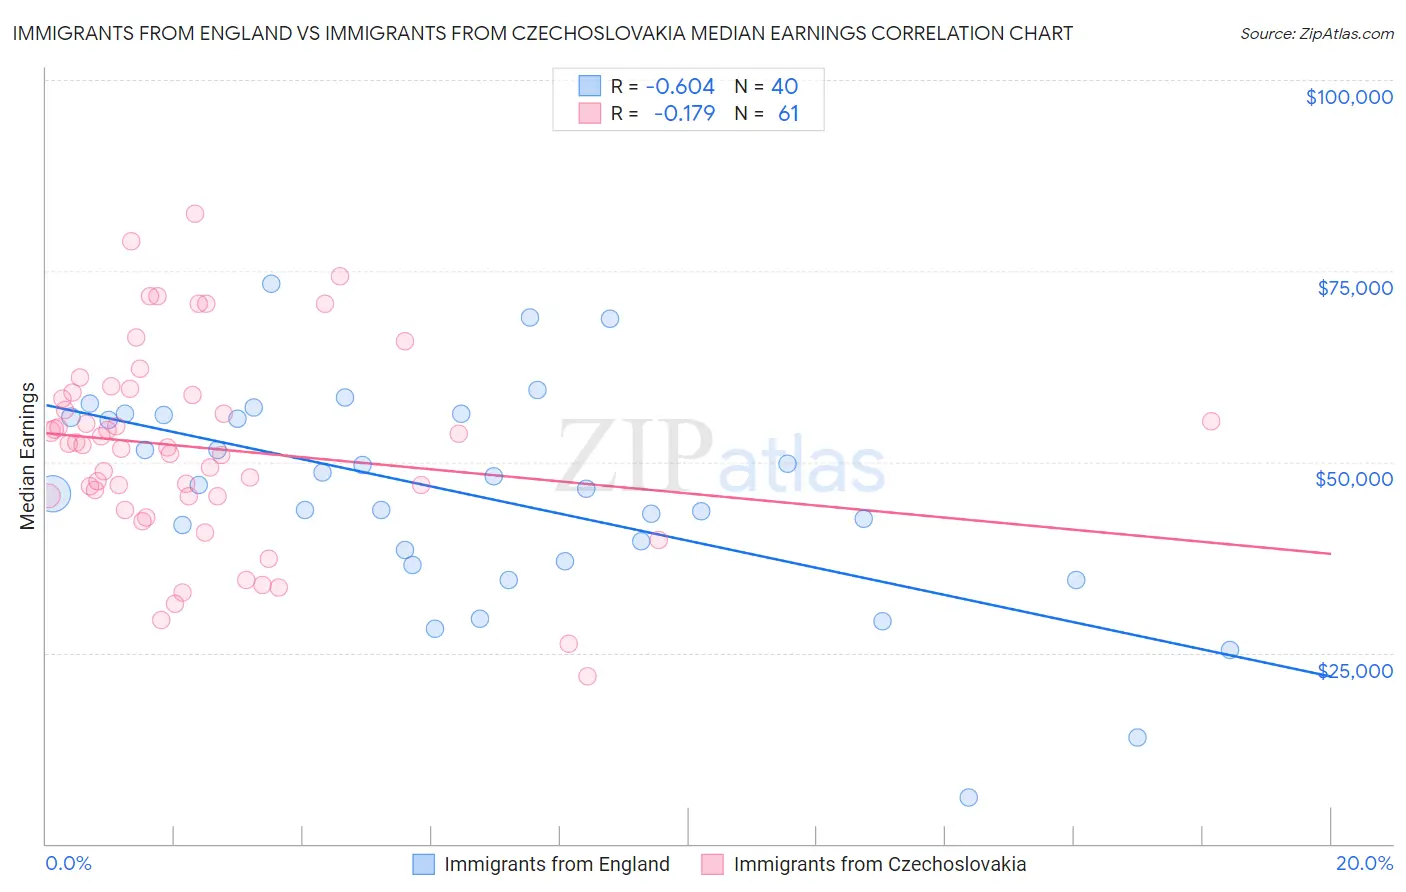
Immigrants from England vs Immigrants from Czechoslovakia Median Earnings Correlation Chart
The statistical analysis conducted on geographies consisting of 391,848,083 people shows a significant negative correlation between the proportion of Immigrants from England and median earnings in the United States with a correlation coefficient (R) of -0.604 and weighted average of $49,722. Similarly, the statistical analysis conducted on geographies consisting of 195,449,585 people shows a poor negative correlation between the proportion of Immigrants from Czechoslovakia and median earnings in the United States with a correlation coefficient (R) of -0.179 and weighted average of $52,361, a difference of 5.3%.
Median Earnings Correlation Summary
| Measurement | Immigrants from England | Immigrants from Czechoslovakia |
| Minimum | $5,997 | $21,875 |
| Maximum | $73,280 | $82,450 |
| Range | $67,283 | $60,575 |
| Mean | $45,709 | $51,817 |
| Median | $46,726 | $52,166 |
| Interquartile 25% (IQ1) | $37,678 | $45,495 |
| Interquartile 75% (IQ3) | $55,979 | $58,910 |
| Interquartile Range (IQR) | $18,301 | $13,415 |
| Standard Deviation (Sample) | $13,949 | $12,779 |
| Standard Deviation (Population) | $13,773 | $12,674 |
Similar Demographics by Median Earnings
Demographics Similar to Immigrants from England by Median Earnings
In terms of median earnings, the demographic groups most similar to Immigrants from England are Croatian ($49,724, a difference of 0.0%), Immigrants from Lebanon ($49,682, a difference of 0.080%), Immigrants from North Macedonia ($49,658, a difference of 0.13%), Immigrants from Northern Africa ($49,648, a difference of 0.15%), and Armenian ($49,804, a difference of 0.16%).
| Demographics | Rating | Rank | Median Earnings |
| Albanians | 99.4 /100 | #88 | Exceptional $50,116 |
| Immigrants | North America | 99.4 /100 | #89 | Exceptional $50,108 |
| Italians | 99.3 /100 | #90 | Exceptional $49,915 |
| Macedonians | 99.2 /100 | #91 | Exceptional $49,893 |
| Immigrants | Argentina | 99.2 /100 | #92 | Exceptional $49,841 |
| Armenians | 99.1 /100 | #93 | Exceptional $49,804 |
| Croatians | 99.0 /100 | #94 | Exceptional $49,724 |
| Immigrants | England | 99.0 /100 | #95 | Exceptional $49,722 |
| Immigrants | Lebanon | 99.0 /100 | #96 | Exceptional $49,682 |
| Immigrants | North Macedonia | 98.9 /100 | #97 | Exceptional $49,658 |
| Immigrants | Northern Africa | 98.9 /100 | #98 | Exceptional $49,648 |
| Immigrants | Afghanistan | 98.9 /100 | #99 | Exceptional $49,645 |
| Immigrants | Poland | 98.9 /100 | #100 | Exceptional $49,633 |
| Jordanians | 98.9 /100 | #101 | Exceptional $49,632 |
| Ethiopians | 98.8 /100 | #102 | Exceptional $49,572 |
Demographics Similar to Immigrants from Czechoslovakia by Median Earnings
In terms of median earnings, the demographic groups most similar to Immigrants from Czechoslovakia are Bhutanese ($52,297, a difference of 0.12%), Australian ($52,294, a difference of 0.13%), Immigrants from Malaysia ($52,514, a difference of 0.29%), Bulgarian ($52,512, a difference of 0.29%), and Maltese ($52,526, a difference of 0.31%).
| Demographics | Rating | Rank | Median Earnings |
| Latvians | 100.0 /100 | #38 | Exceptional $53,001 |
| Immigrants | Turkey | 100.0 /100 | #39 | Exceptional $52,960 |
| Israelis | 100.0 /100 | #40 | Exceptional $52,937 |
| Immigrants | Lithuania | 100.0 /100 | #41 | Exceptional $52,769 |
| Maltese | 100.0 /100 | #42 | Exceptional $52,526 |
| Immigrants | Malaysia | 100.0 /100 | #43 | Exceptional $52,514 |
| Bulgarians | 100.0 /100 | #44 | Exceptional $52,512 |
| Immigrants | Czechoslovakia | 100.0 /100 | #45 | Exceptional $52,361 |
| Bhutanese | 100.0 /100 | #46 | Exceptional $52,297 |
| Australians | 100.0 /100 | #47 | Exceptional $52,294 |
| Immigrants | Europe | 100.0 /100 | #48 | Exceptional $52,195 |
| Bolivians | 100.0 /100 | #49 | Exceptional $52,005 |
| Immigrants | South Africa | 100.0 /100 | #50 | Exceptional $51,850 |
| Immigrants | Austria | 99.9 /100 | #51 | Exceptional $51,826 |
| Estonians | 99.9 /100 | #52 | Exceptional $51,772 |