Immigrants from Dominica vs Iroquois Median Household Income
COMPARE
Immigrants from Dominica
Iroquois
Median Household Income
Median Household Income Comparison
Immigrants from Dominica
Iroquois
$72,760
MEDIAN HOUSEHOLD INCOME
0.0/ 100
METRIC RATING
300th/ 347
METRIC RANK
$74,279
MEDIAN HOUSEHOLD INCOME
0.1/ 100
METRIC RATING
287th/ 347
METRIC RANK
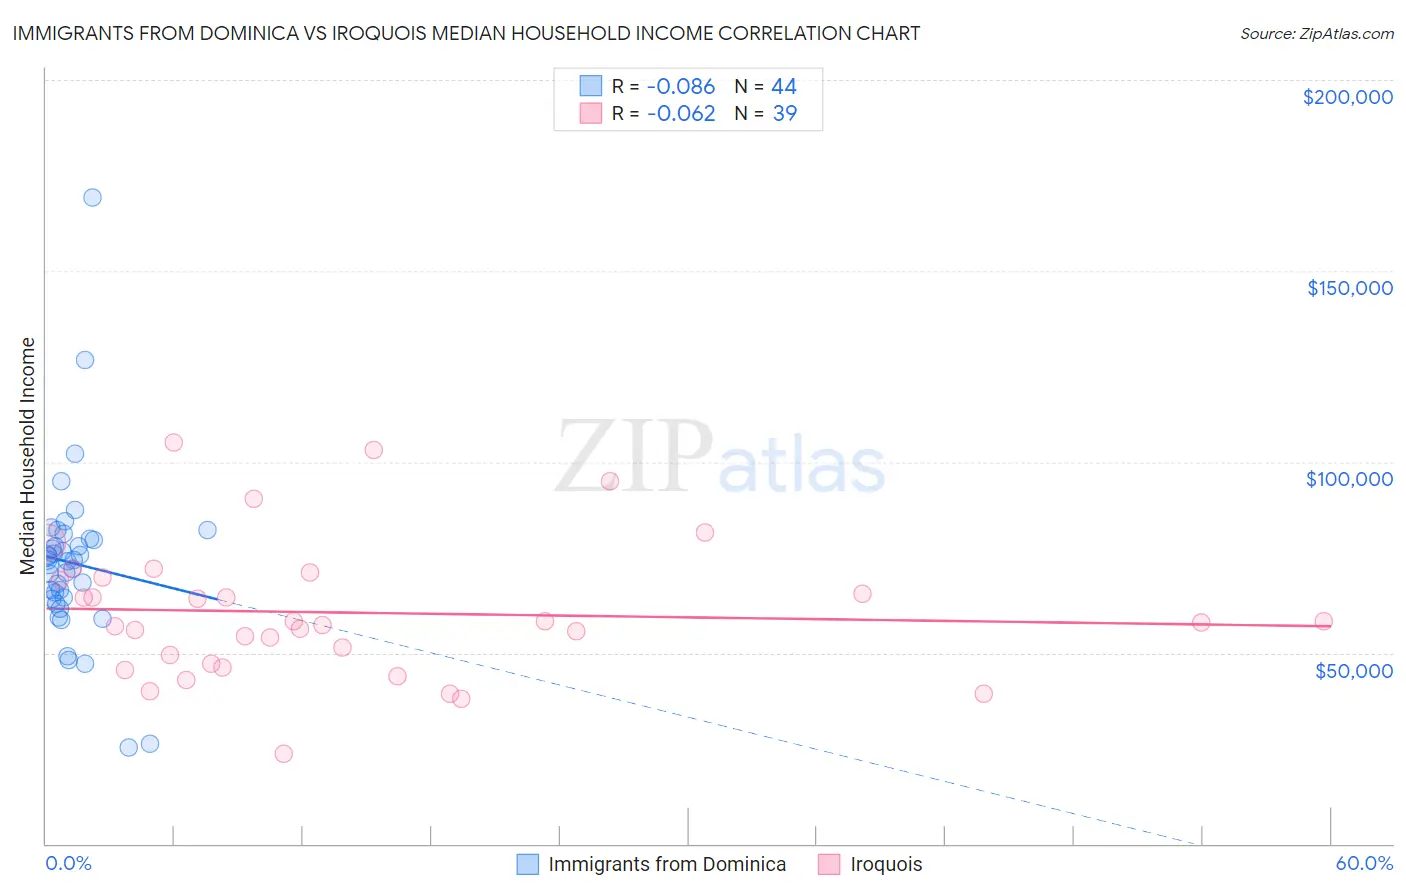
Immigrants from Dominica vs Iroquois Median Household Income Correlation Chart
The statistical analysis conducted on geographies consisting of 83,788,429 people shows a slight negative correlation between the proportion of Immigrants from Dominica and median household income in the United States with a correlation coefficient (R) of -0.086 and weighted average of $72,760. Similarly, the statistical analysis conducted on geographies consisting of 207,210,720 people shows a slight negative correlation between the proportion of Iroquois and median household income in the United States with a correlation coefficient (R) of -0.062 and weighted average of $74,279, a difference of 2.1%.
Median Household Income Correlation Summary
| Measurement | Immigrants from Dominica | Iroquois |
| Minimum | $25,050 | $23,438 |
| Maximum | $169,141 | $105,077 |
| Range | $144,091 | $81,639 |
| Mean | $73,512 | $60,531 |
| Median | $74,253 | $57,969 |
| Interquartile 25% (IQ1) | $64,327 | $47,045 |
| Interquartile 75% (IQ3) | $79,686 | $69,753 |
| Interquartile Range (IQR) | $15,359 | $22,708 |
| Standard Deviation (Sample) | $22,542 | $17,808 |
| Standard Deviation (Population) | $22,284 | $17,578 |
Demographics Similar to Immigrants from Dominica and Iroquois by Median Household Income
In terms of median household income, the demographic groups most similar to Immigrants from Dominica are Cherokee ($72,682, a difference of 0.11%), Indonesian ($72,856, a difference of 0.13%), Shoshone ($72,660, a difference of 0.14%), African ($72,650, a difference of 0.15%), and Paiute ($72,959, a difference of 0.27%). Similarly, the demographic groups most similar to Iroquois are Immigrants from Somalia ($74,300, a difference of 0.030%), Immigrants from Central America ($74,217, a difference of 0.080%), Fijian ($74,205, a difference of 0.10%), Mexican ($74,399, a difference of 0.16%), and Bangladeshi ($74,112, a difference of 0.23%).
| Demographics | Rating | Rank | Median Household Income |
| Cree | 0.1 /100 | #283 | Tragic $74,685 |
| Yaqui | 0.1 /100 | #284 | Tragic $74,596 |
| Mexicans | 0.1 /100 | #285 | Tragic $74,399 |
| Immigrants | Somalia | 0.1 /100 | #286 | Tragic $74,300 |
| Iroquois | 0.1 /100 | #287 | Tragic $74,279 |
| Immigrants | Central America | 0.1 /100 | #288 | Tragic $74,217 |
| Fijians | 0.1 /100 | #289 | Tragic $74,205 |
| Bangladeshis | 0.1 /100 | #290 | Tragic $74,112 |
| Hispanics or Latinos | 0.1 /100 | #291 | Tragic $73,823 |
| Comanche | 0.1 /100 | #292 | Tragic $73,747 |
| Immigrants | Cabo Verde | 0.1 /100 | #293 | Tragic $73,515 |
| Blackfeet | 0.1 /100 | #294 | Tragic $73,509 |
| Cubans | 0.1 /100 | #295 | Tragic $73,392 |
| Haitians | 0.1 /100 | #296 | Tragic $73,306 |
| Immigrants | Mexico | 0.0 /100 | #297 | Tragic $73,160 |
| Paiute | 0.0 /100 | #298 | Tragic $72,959 |
| Indonesians | 0.0 /100 | #299 | Tragic $72,856 |
| Immigrants | Dominica | 0.0 /100 | #300 | Tragic $72,760 |
| Cherokee | 0.0 /100 | #301 | Tragic $72,682 |
| Shoshone | 0.0 /100 | #302 | Tragic $72,660 |
| Africans | 0.0 /100 | #303 | Tragic $72,650 |