Immigrants from Dominica vs Cape Verdean Median Household Income
COMPARE
Immigrants from Dominica
Cape Verdean
Median Household Income
Median Household Income Comparison
Immigrants from Dominica
Cape Verdeans
$72,760
MEDIAN HOUSEHOLD INCOME
0.0/ 100
METRIC RATING
300th/ 347
METRIC RANK
$75,848
MEDIAN HOUSEHOLD INCOME
0.3/ 100
METRIC RATING
269th/ 347
METRIC RANK
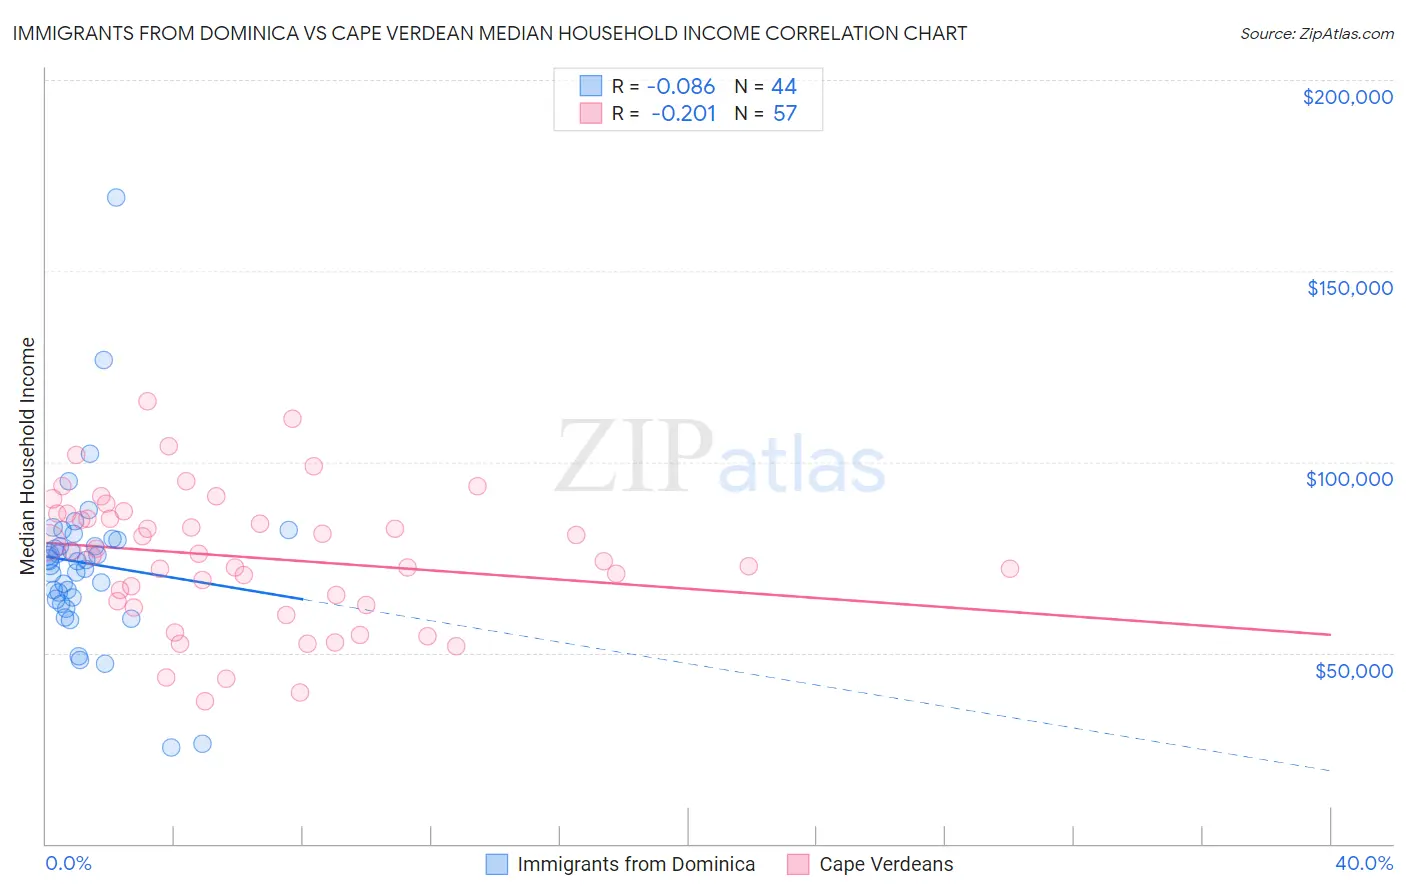
Immigrants from Dominica vs Cape Verdean Median Household Income Correlation Chart
The statistical analysis conducted on geographies consisting of 83,788,429 people shows a slight negative correlation between the proportion of Immigrants from Dominica and median household income in the United States with a correlation coefficient (R) of -0.086 and weighted average of $72,760. Similarly, the statistical analysis conducted on geographies consisting of 107,534,548 people shows a weak negative correlation between the proportion of Cape Verdeans and median household income in the United States with a correlation coefficient (R) of -0.201 and weighted average of $75,848, a difference of 4.3%.
Median Household Income Correlation Summary
| Measurement | Immigrants from Dominica | Cape Verdean |
| Minimum | $25,050 | $37,158 |
| Maximum | $169,141 | $115,791 |
| Range | $144,091 | $78,633 |
| Mean | $73,512 | $75,036 |
| Median | $74,253 | $76,048 |
| Interquartile 25% (IQ1) | $64,327 | $63,051 |
| Interquartile 75% (IQ3) | $79,686 | $86,492 |
| Interquartile Range (IQR) | $15,359 | $23,441 |
| Standard Deviation (Sample) | $22,542 | $17,562 |
| Standard Deviation (Population) | $22,284 | $17,408 |
Similar Demographics by Median Household Income
Demographics Similar to Immigrants from Dominica by Median Household Income
In terms of median household income, the demographic groups most similar to Immigrants from Dominica are Cherokee ($72,682, a difference of 0.11%), Indonesian ($72,856, a difference of 0.13%), Shoshone ($72,660, a difference of 0.14%), African ($72,650, a difference of 0.15%), and Immigrants from Haiti ($72,599, a difference of 0.22%).
| Demographics | Rating | Rank | Median Household Income |
| Immigrants | Cabo Verde | 0.1 /100 | #293 | Tragic $73,515 |
| Blackfeet | 0.1 /100 | #294 | Tragic $73,509 |
| Cubans | 0.1 /100 | #295 | Tragic $73,392 |
| Haitians | 0.1 /100 | #296 | Tragic $73,306 |
| Immigrants | Mexico | 0.0 /100 | #297 | Tragic $73,160 |
| Paiute | 0.0 /100 | #298 | Tragic $72,959 |
| Indonesians | 0.0 /100 | #299 | Tragic $72,856 |
| Immigrants | Dominica | 0.0 /100 | #300 | Tragic $72,760 |
| Cherokee | 0.0 /100 | #301 | Tragic $72,682 |
| Shoshone | 0.0 /100 | #302 | Tragic $72,660 |
| Africans | 0.0 /100 | #303 | Tragic $72,650 |
| Immigrants | Haiti | 0.0 /100 | #304 | Tragic $72,599 |
| Hondurans | 0.0 /100 | #305 | Tragic $72,588 |
| Potawatomi | 0.0 /100 | #306 | Tragic $72,576 |
| Ute | 0.0 /100 | #307 | Tragic $72,402 |
Demographics Similar to Cape Verdeans by Median Household Income
In terms of median household income, the demographic groups most similar to Cape Verdeans are Immigrants from Jamaica ($75,851, a difference of 0.0%), German Russian ($75,856, a difference of 0.010%), Hmong ($75,839, a difference of 0.010%), Pennsylvania German ($75,814, a difference of 0.050%), and Somali ($75,782, a difference of 0.090%).
| Demographics | Rating | Rank | Median Household Income |
| French American Indians | 0.4 /100 | #262 | Tragic $76,387 |
| Alaskan Athabascans | 0.4 /100 | #263 | Tragic $76,383 |
| Guatemalans | 0.3 /100 | #264 | Tragic $75,961 |
| Immigrants | Belize | 0.3 /100 | #265 | Tragic $75,938 |
| Americans | 0.3 /100 | #266 | Tragic $75,932 |
| German Russians | 0.3 /100 | #267 | Tragic $75,856 |
| Immigrants | Jamaica | 0.3 /100 | #268 | Tragic $75,851 |
| Cape Verdeans | 0.3 /100 | #269 | Tragic $75,848 |
| Hmong | 0.3 /100 | #270 | Tragic $75,839 |
| Pennsylvania Germans | 0.3 /100 | #271 | Tragic $75,814 |
| Somalis | 0.3 /100 | #272 | Tragic $75,782 |
| Liberians | 0.2 /100 | #273 | Tragic $75,667 |
| British West Indians | 0.2 /100 | #274 | Tragic $75,647 |
| Immigrants | Micronesia | 0.2 /100 | #275 | Tragic $75,574 |
| Immigrants | Latin America | 0.2 /100 | #276 | Tragic $75,420 |