Immigrants from Dominica vs Immigrants from Kazakhstan Median Household Income
COMPARE
Immigrants from Dominica
Immigrants from Kazakhstan
Median Household Income
Median Household Income Comparison
Immigrants from Dominica
Immigrants from Kazakhstan
$72,760
MEDIAN HOUSEHOLD INCOME
0.0/ 100
METRIC RATING
300th/ 347
METRIC RANK
$91,015
MEDIAN HOUSEHOLD INCOME
97.8/ 100
METRIC RATING
104th/ 347
METRIC RANK
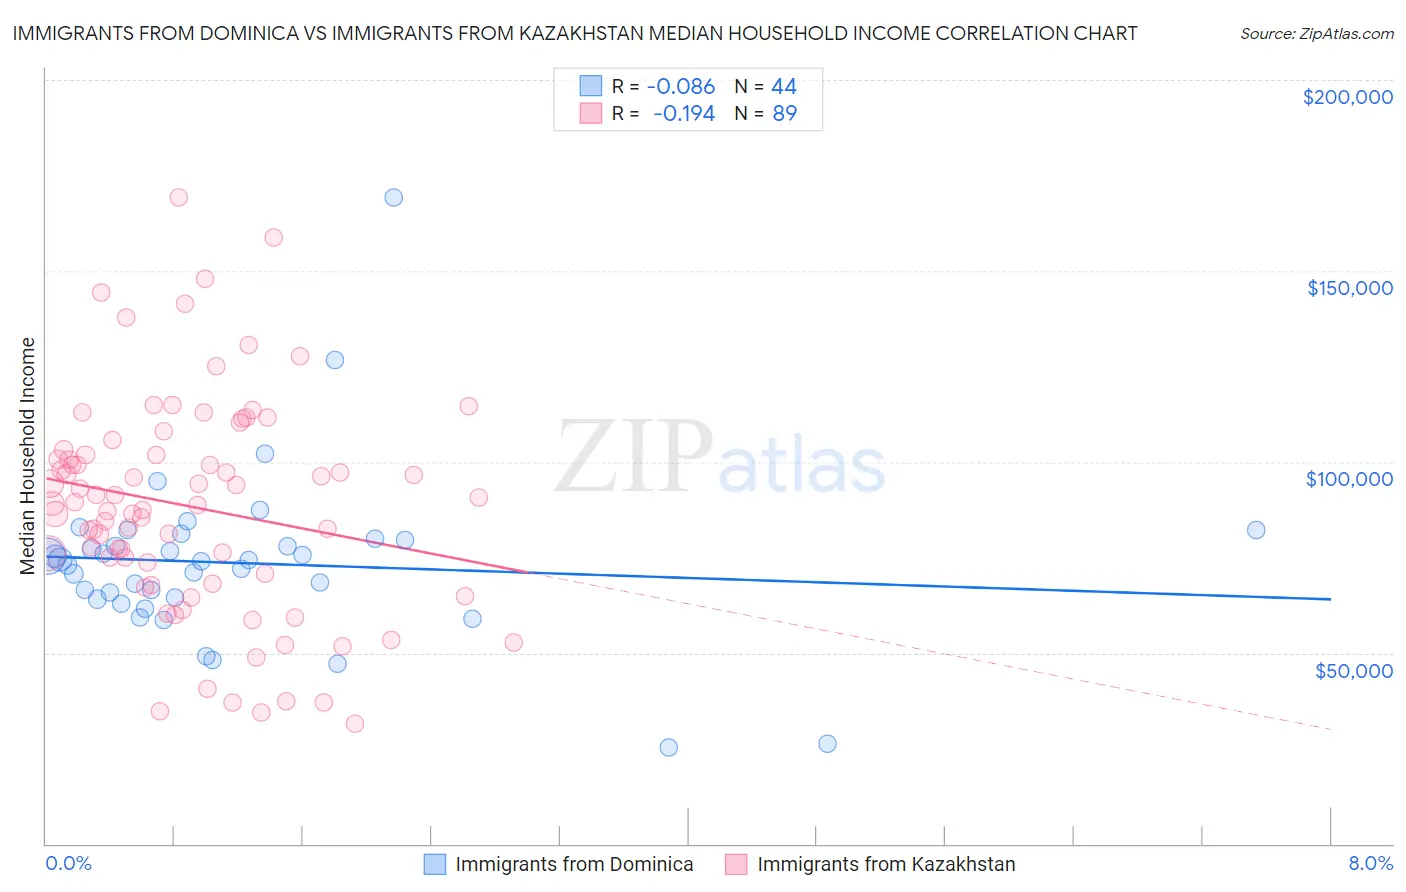
Immigrants from Dominica vs Immigrants from Kazakhstan Median Household Income Correlation Chart
The statistical analysis conducted on geographies consisting of 83,788,429 people shows a slight negative correlation between the proportion of Immigrants from Dominica and median household income in the United States with a correlation coefficient (R) of -0.086 and weighted average of $72,760. Similarly, the statistical analysis conducted on geographies consisting of 124,425,311 people shows a poor negative correlation between the proportion of Immigrants from Kazakhstan and median household income in the United States with a correlation coefficient (R) of -0.194 and weighted average of $91,015, a difference of 25.1%.
Median Household Income Correlation Summary
| Measurement | Immigrants from Dominica | Immigrants from Kazakhstan |
| Minimum | $25,050 | $31,369 |
| Maximum | $169,141 | $169,141 |
| Range | $144,091 | $137,772 |
| Mean | $73,512 | $88,237 |
| Median | $74,253 | $88,972 |
| Interquartile 25% (IQ1) | $64,327 | $69,524 |
| Interquartile 75% (IQ3) | $79,686 | $102,378 |
| Interquartile Range (IQR) | $15,359 | $32,854 |
| Standard Deviation (Sample) | $22,542 | $28,398 |
| Standard Deviation (Population) | $22,284 | $28,238 |
Similar Demographics by Median Household Income
Demographics Similar to Immigrants from Dominica by Median Household Income
In terms of median household income, the demographic groups most similar to Immigrants from Dominica are Cherokee ($72,682, a difference of 0.11%), Indonesian ($72,856, a difference of 0.13%), Shoshone ($72,660, a difference of 0.14%), African ($72,650, a difference of 0.15%), and Immigrants from Haiti ($72,599, a difference of 0.22%).
| Demographics | Rating | Rank | Median Household Income |
| Immigrants | Cabo Verde | 0.1 /100 | #293 | Tragic $73,515 |
| Blackfeet | 0.1 /100 | #294 | Tragic $73,509 |
| Cubans | 0.1 /100 | #295 | Tragic $73,392 |
| Haitians | 0.1 /100 | #296 | Tragic $73,306 |
| Immigrants | Mexico | 0.0 /100 | #297 | Tragic $73,160 |
| Paiute | 0.0 /100 | #298 | Tragic $72,959 |
| Indonesians | 0.0 /100 | #299 | Tragic $72,856 |
| Immigrants | Dominica | 0.0 /100 | #300 | Tragic $72,760 |
| Cherokee | 0.0 /100 | #301 | Tragic $72,682 |
| Shoshone | 0.0 /100 | #302 | Tragic $72,660 |
| Africans | 0.0 /100 | #303 | Tragic $72,650 |
| Immigrants | Haiti | 0.0 /100 | #304 | Tragic $72,599 |
| Hondurans | 0.0 /100 | #305 | Tragic $72,588 |
| Potawatomi | 0.0 /100 | #306 | Tragic $72,576 |
| Ute | 0.0 /100 | #307 | Tragic $72,402 |
Demographics Similar to Immigrants from Kazakhstan by Median Household Income
In terms of median household income, the demographic groups most similar to Immigrants from Kazakhstan are Immigrants from Ukraine ($91,124, a difference of 0.12%), Immigrants from Brazil ($90,907, a difference of 0.12%), Macedonian ($90,761, a difference of 0.28%), Austrian ($91,339, a difference of 0.36%), and Croatian ($90,685, a difference of 0.36%).
| Demographics | Rating | Rank | Median Household Income |
| Immigrants | Serbia | 98.6 /100 | #97 | Exceptional $91,730 |
| Immigrants | Southern Europe | 98.5 /100 | #98 | Exceptional $91,605 |
| Immigrants | South Eastern Asia | 98.4 /100 | #99 | Exceptional $91,541 |
| Ukrainians | 98.3 /100 | #100 | Exceptional $91,456 |
| Immigrants | Moldova | 98.3 /100 | #101 | Exceptional $91,446 |
| Austrians | 98.2 /100 | #102 | Exceptional $91,339 |
| Immigrants | Ukraine | 98.0 /100 | #103 | Exceptional $91,124 |
| Immigrants | Kazakhstan | 97.8 /100 | #104 | Exceptional $91,015 |
| Immigrants | Brazil | 97.7 /100 | #105 | Exceptional $90,907 |
| Macedonians | 97.4 /100 | #106 | Exceptional $90,761 |
| Croatians | 97.3 /100 | #107 | Exceptional $90,685 |
| Zimbabweans | 97.2 /100 | #108 | Exceptional $90,618 |
| Chileans | 97.2 /100 | #109 | Exceptional $90,605 |
| Palestinians | 97.1 /100 | #110 | Exceptional $90,574 |
| Immigrants | Poland | 97.1 /100 | #111 | Exceptional $90,549 |